The general market conditions are not conductive now. The industrial world has come to a standstill, and the future of the economy is unpredictable. I am not sure whether the strategies for the VUCA world can come to our protection, as this pandemic is posing unprecedented challenges and troubles. Let us discuss how Kaizen can help to fight the COVID challenges.
The manufacturing companies are facing typical challenges ahead. No one is sure about their global and local supply chain intactness. Companies will have to wait and see to validate the changes in customer behaviours. It is tough to predict when the cashflows become normal and customers get back their purchasing power.
Manufacturers’ Problems
The manufacturing industry faces specific challenges like workforce unable to reach the factories, delays in material transportation, availability of raw materials and packing materials. There is social and administrative pressure to keep paying the staff despite zero production and sale.
Sure, there are a lot of uncertainties ahead. People keep asking what we can do to save some cost or reduce the burden of lack of workforce (availability of migrated workers is still a question mark).
When everything around us goes out of control, start focussing inside.
Yes, we are sure there is still something in our control – our plant productivity. For people who are responsible for the manufacturing plant, there is a social responsibility as well now to improve plant productivity.
How can we do that and do that rapidly?
We have a proven way. I want to present a case study on rapid productivity improvement based on the Kaizen Methodology. I sincerely hope this study shows some ways to improve your plant efficiency by yourself, triggers some discussions in the positive direction, flashes some ideas. In essence, all of them take you and humanity a step ahead.
Can you make people work more?
I had a lengthy discussion with one of the participants of black belt training (I will call him Mr Vinay). He was asking me about the use of the Time and Motion study and its relevance today.
I am a firm believer of kaizen thinking, which says
‘People are always right’.
My guru used challenge managers
“Can you show me one operator who comes to the factory to delay the order or to break the machine down or to produce an inferior quality product?”
Their intentions are always right. It is our system that keeps them from contributing in the right way.
The Kaizen Way
Then I explained the kaizen way of productivity improvement. The Kaizen way utilises the latent talents of people by encouraging them to identify and talk about their problems.
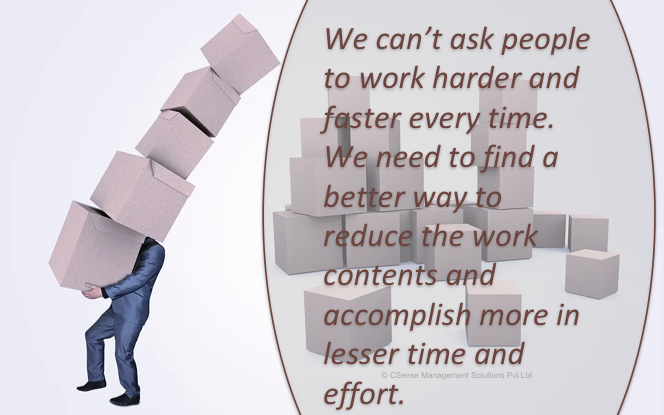
While the conventional productivity improvements measure the reduction of the workforce, the Kaizen encourages people to exhibit their process problems, face them and solve them with the least expense and in a short time. While the conventional methodologies are counting the number of jobs done at a given time, Kaizen questions the presence of all those activities.
Kaizen defines the activities that consume resources but fail to contribute in value addition as Non-Value Adding Activities. It says, more than 95% of activities on a conventional shop floor are such activities. Only 5% of activities contribute to value addition, and that is called Value-Adding Activities.
With this paradigm of VA & NVA, instead of asking people to work more and work fast, Kaizen asks people to observe NVA and reduce them. This leads to the famous saying of
‘doing less and producing more’.
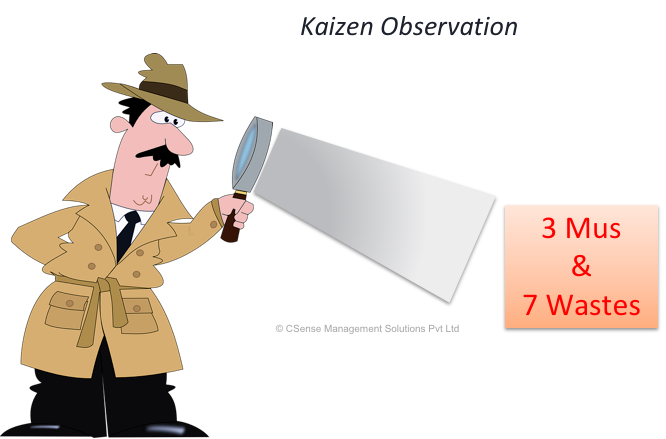
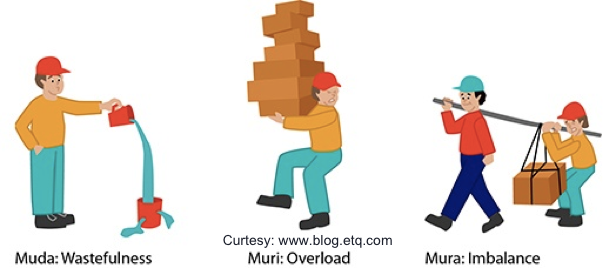
The Kaizen and the 3 Mu’s
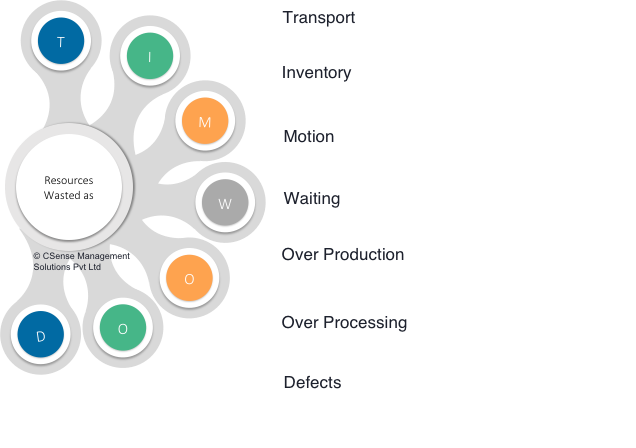
Kaizen talks about identifying and reducing the 3 Mu’s from the operations, namely
Muda (the wasted efforts),
Mura (variation between processes) and
Muri (physical strain to workers and machines)
Reducing the Mu’s would reduce processing time, reduced inventories, reduced defects, reduced cost of operations, improved working conditions, and higher throughput.
After completing the black belt course, Mr Vinay invited me to his office. He wanted me to conduct a diagnosis study at one of their plants to reduce operations costs.
Manpower Assessment
We generally get calls from HR managers and VPs requesting a time study. They would want to know whether they are under-staffed or over-staffed. Their intentions are right. They want to find out whether their people productivity is good, is there any opportunity to improve that or do we need to provide more people to support the operations.
They would require a detailed scientific study so that they can convince their operations counterparts. The time and motion study will suit their requirements.
The Lean Diagnosis Study
I would convince them to do a Kaizen Diagnosis Study, which will reveal opportunities for improvements along with the report of people productivity. In most cases, both the parties in debate, the HR and the Operations people would be happy in the end.
The Diagnosis report will talk about the productivity levels and importantly, the opportunities in hand to improve productivity significantly.
The Assignment
Mr Vinay was a Vice President of HR in one of the large mining conglomerates in Mumbai. They have their mining and processing sites in Gujarat. They excavate minerals from the mines, conduct a chemical treatment followed by physical treatment and pack them under different grades.
The corporate team feels that the plant’s processing cost is high and keep increasing year on year. Their dire need was to find out ways to control the cost and bring it down by 1% (against the cost of product) year on year.
They said the plant is also trying to deploy various cost-saving measures like energy efficiency, water conservation and more. Mr Vinaya arranged a call with the Plant Head, and we agreed for a four-day diagnosis study.
The Diagnosis Study
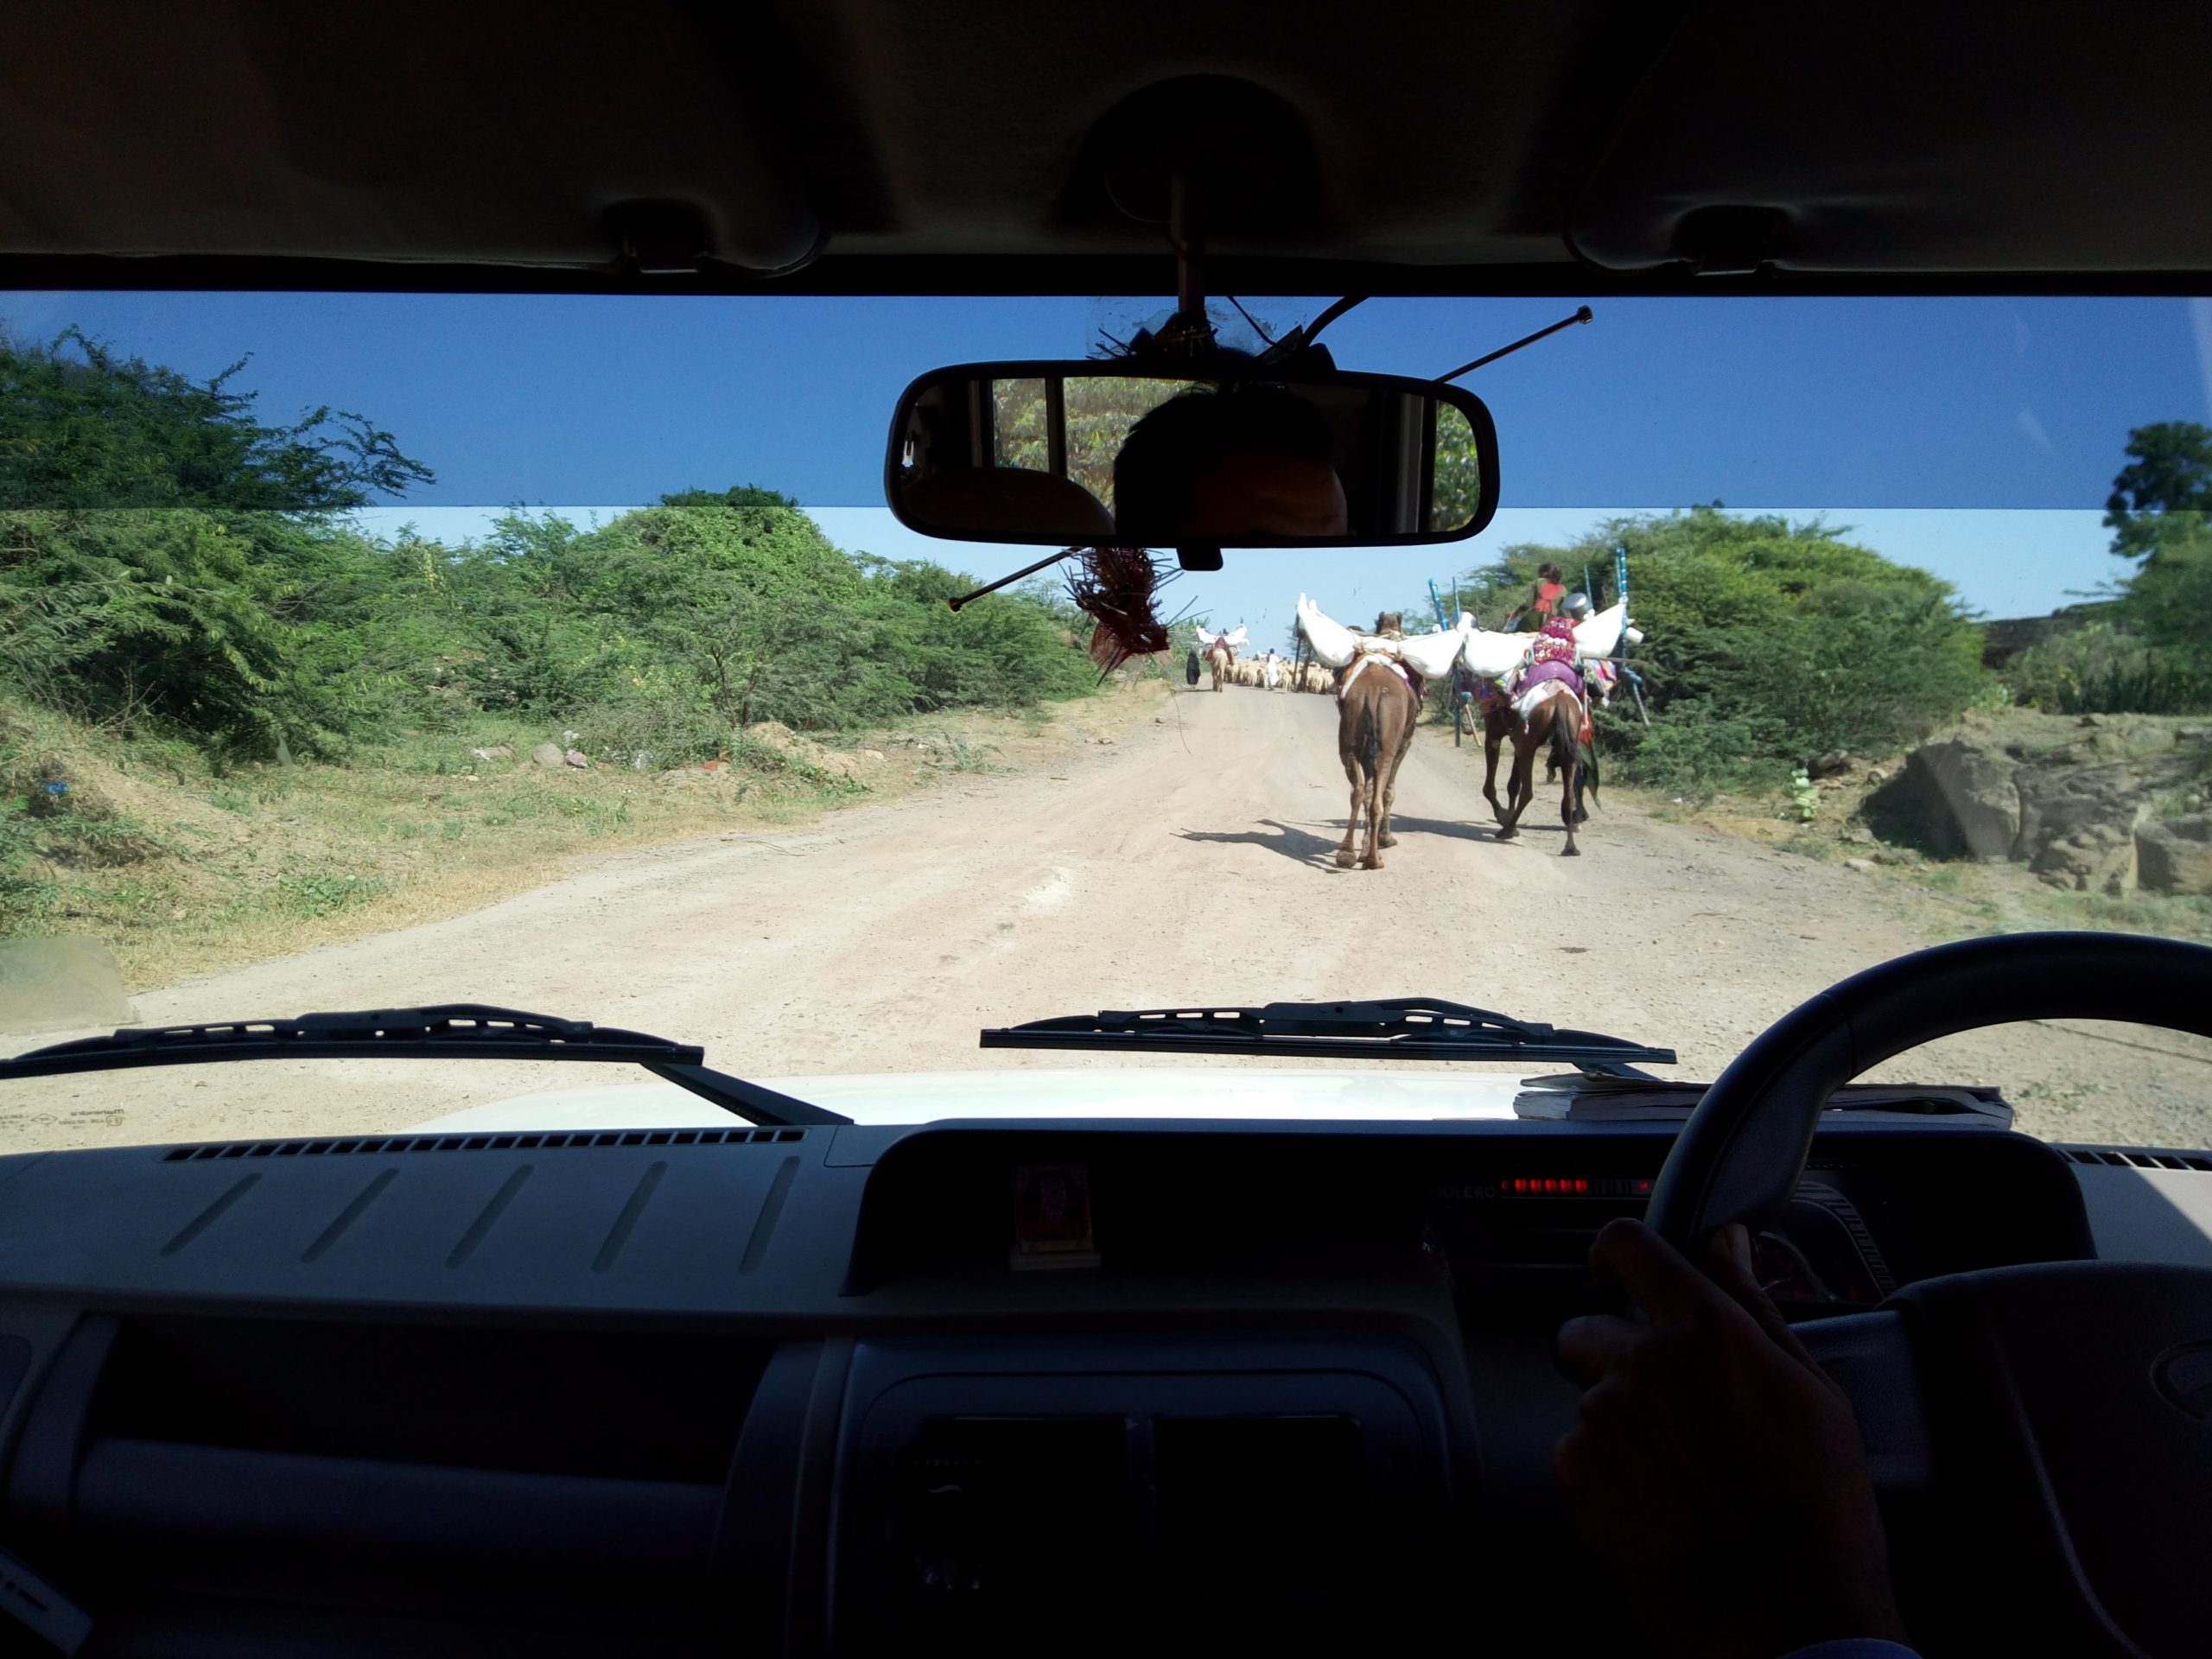
I visited the plant in Gujarat. It was in a town with the nearest airport in Bhuj. The HR Manager, who accompanied me from airport, was explaining many exciting things about the places on our way. He took me through a village and said that the village is having the highest savings deposits in the banks in the entire state, as at least one member from every family will be working abroad.
I observed another speciality about the state – the road network and the quality of roads are phenomenal. Others have to learn how to get such ‘good deals’ from the constructors so that the roads withstand massive vehicular movements and extreme weather changes.
It took us more than 3 hours by road on a Bolero to reach the plant.
I started off the study straightway with a meeting with the Plant Head, Mr Kushal, but everybody preferred to call him as Plant Head. He expressed that they were operating under tight control from all the corners and were unable to get more people required to complete the increasing workload.
He said, “We have tried our best to control the cost. If you are going to say we are under-productive or over-staffed, the corporate people will be happy to accept but plant people won’t. If you say we are understaffed, they are not going to buy it. All we want to know from your report is how can we improve further”.
The Cost-burden
We discussed the major pain points of the plant. He said, 16% of the cost of the product is consumed for material handling, followed by 9% for labour cost. There was a significant share taken by Cost of Quality. The plant is situated in remote areas of Gujarat, in centre of a mining cluster. Both permanent staff and labours are hailing from the nearby villages.
So, they had many people working for several years with them. They were also recruiting senior talents from the city, giving additional compensation to them for the distance. Hence, the people cost was increasing year on year. Ironically, Corporate was expecting them to reduce 1% of their manufacturing cost every year.
The observations
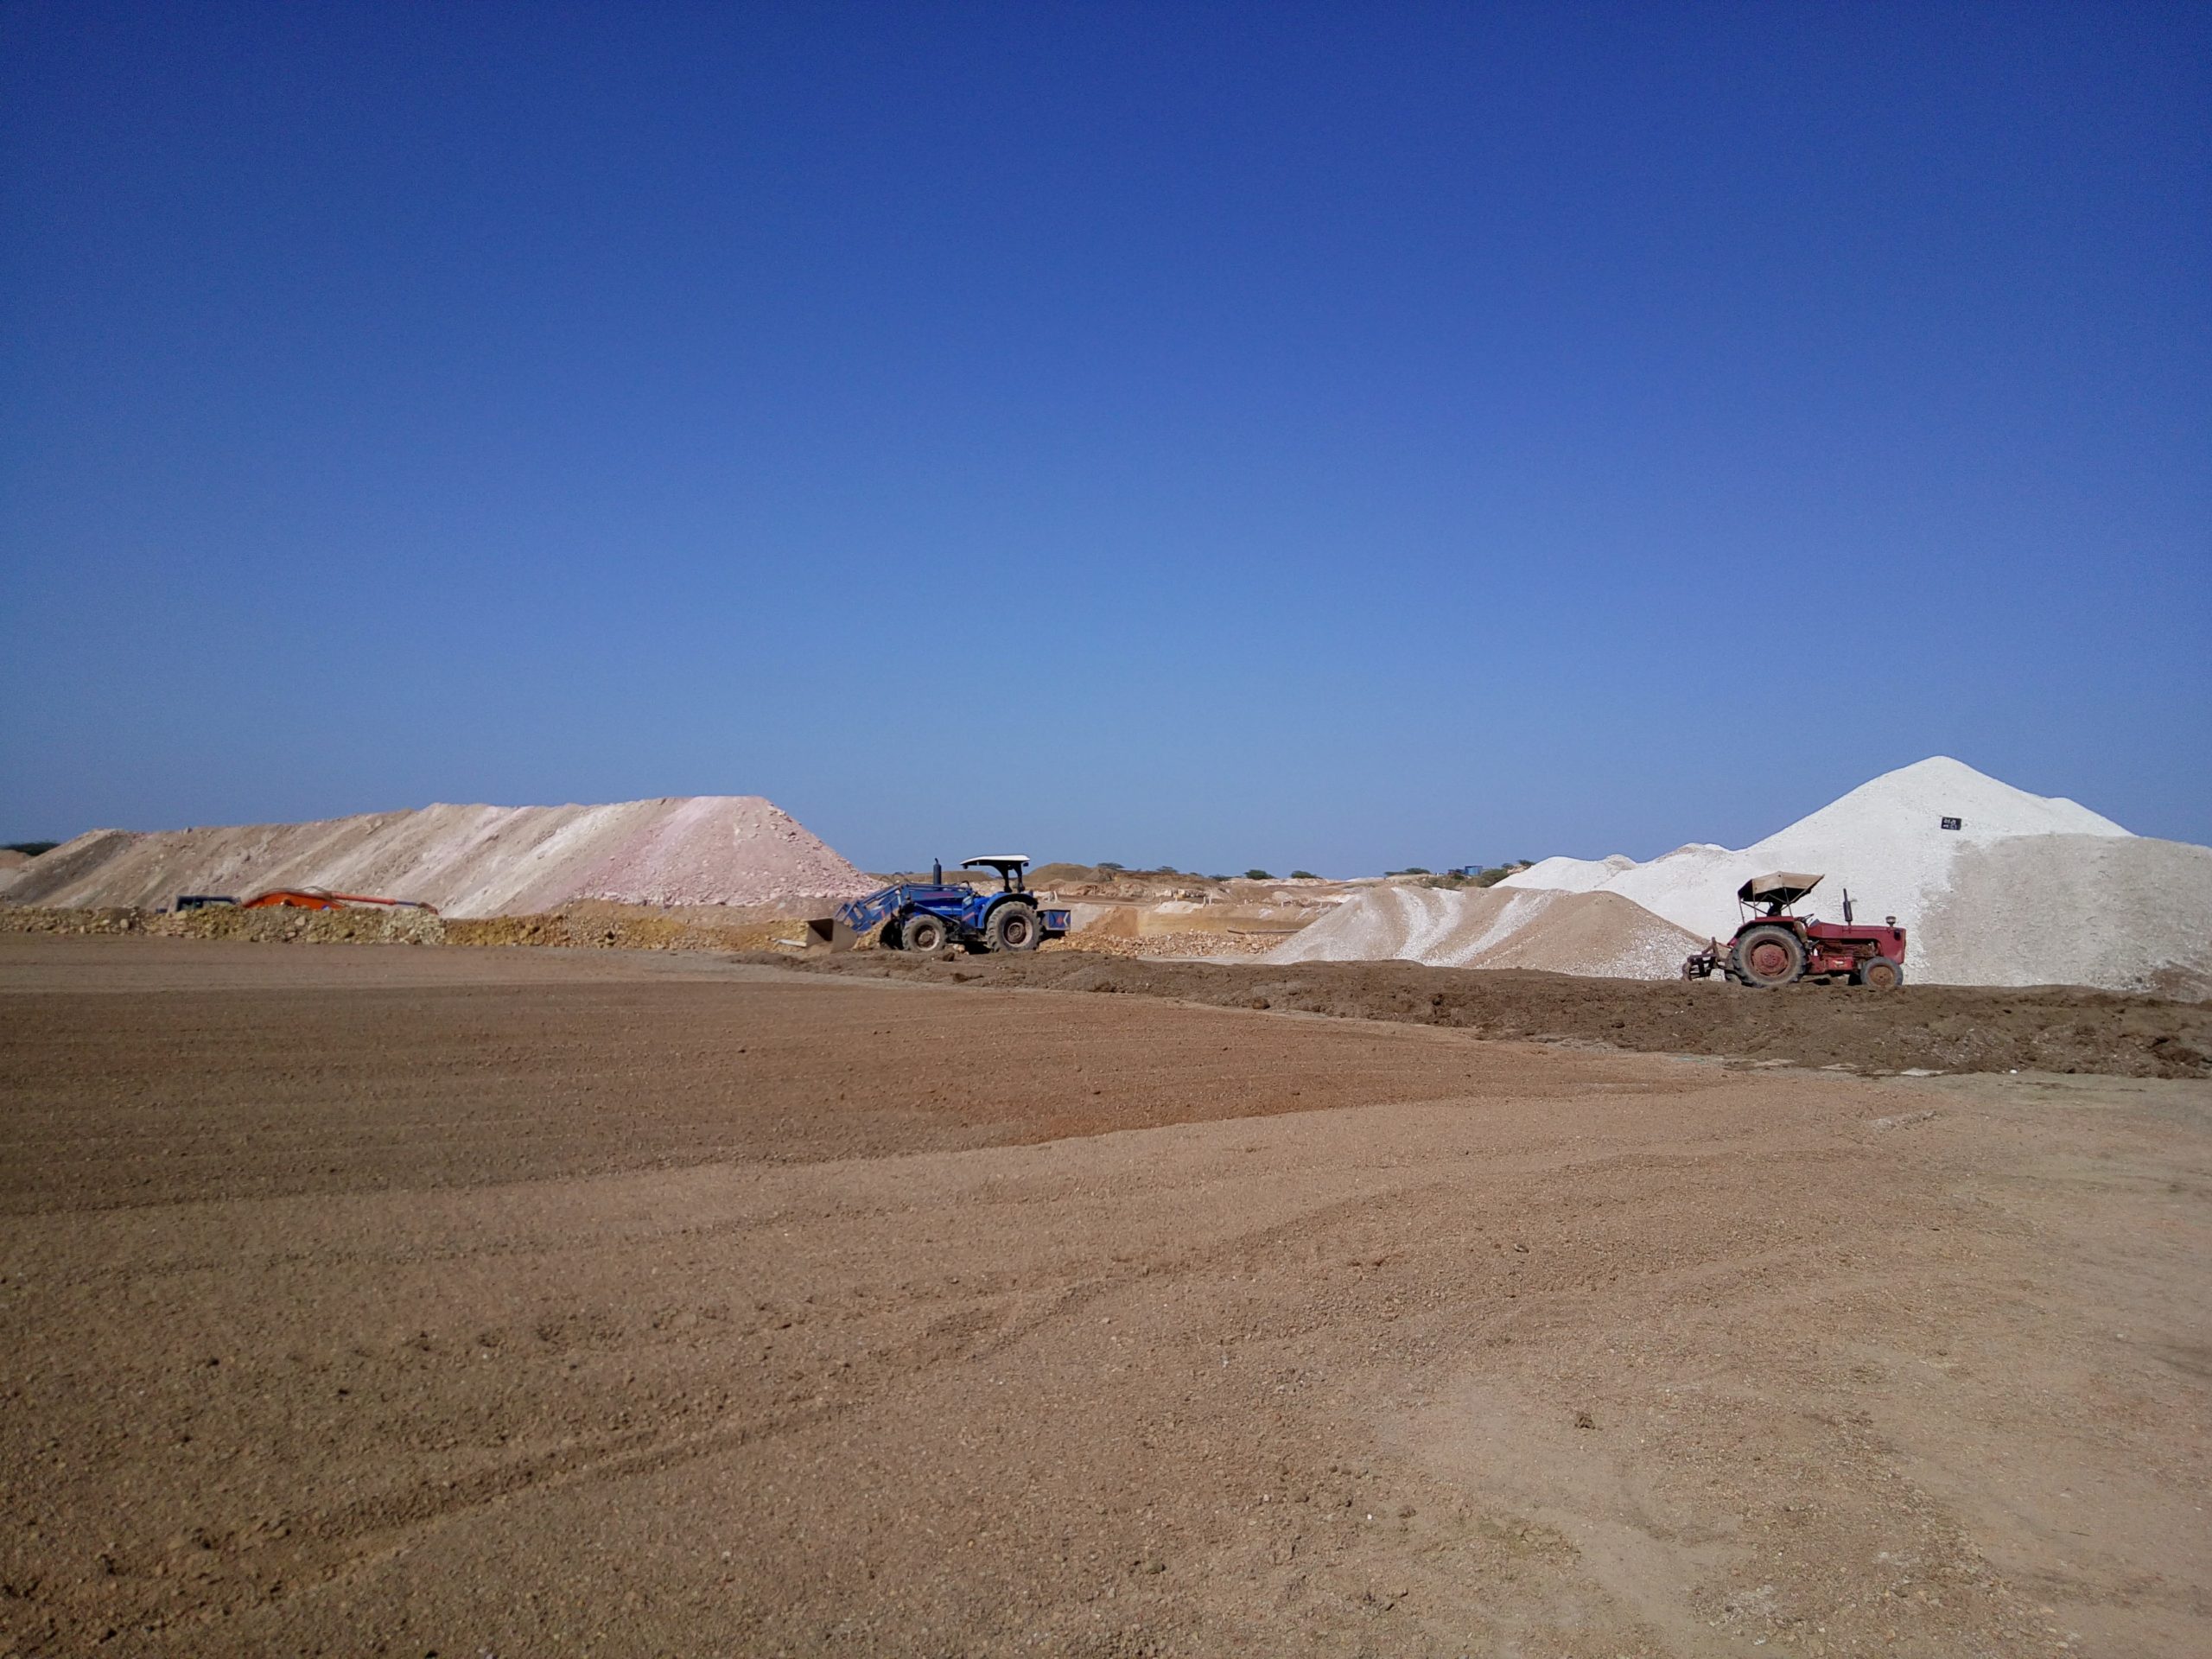
I wanted to start the study along with the flow of processing, i.e., from raw material to finished goods and despatch. Hence, I was taken to various mines nearby where they were currently excavating the mineral. One word to explain – HUGE!
The hump yards
Then on the way back, I was shown another yard called hump yard, where they were keeping the humps of the treated mineral. This processed mineral will be moved to the plant for processing after a few days. It would take them 32 trucks to move one hump to the plant. I was not able to accurately count the number of humps as there were so many humps across several hump yards along the way.
The plant
After reaching the plant, the HR Manager connected me to the Production Manager and Safety Officer. We started with raw material receipt yard, packing material receipt and walked along the blending yard, feeding hoppers, long conveyors taking material from the hoppers, vast pulverising chambers, blenders, packing section, storage and despatch areas.
I was finding it challenging to accommodate the hot conditions of the area and the settling dust. Wanted to sip water as soon as we came out of the processing section. We went to a small building which was a bit noisy with people chitchatting, commenting after reading the newspapers.
Safety officer Mr Ramkrishna arranged some water and buttermilk to drink as we were sitting in the building. The hall was recently built for drivers to take rest and spend their time. There were around 30 to 40 people inside. All of them were drivers of the company buses, cars and cabs.
Opening meeting with Managers
We had scheduled an opening meeting with the managers at 2 pm. We started to walk back to the office building. On our way, the Production Manager Mr Sharma asked me “Sir, are we overstaffed? What do you think?”.
He sounded very pessimistic throughout the discussions. I could understand his frustrations. He said that I was the third or fourth consultant to do the time study from the past two years. “None of them allowed us to defend. They wanted us to run like machines, which is not practically possible. We also tried 5S, but nothing helped”.
After understanding the processes, the working culture of the company, I started the serious part of the study.
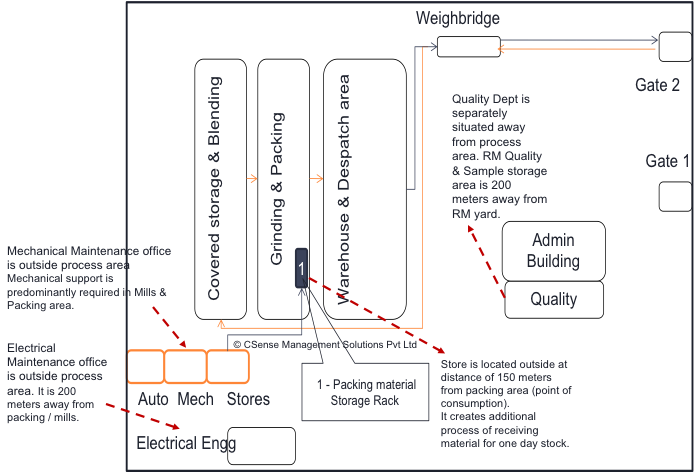
Process Flow Diagram
The first step is to see the flow of processes using a process flow diagram. It took us less than two hours to construct a rough sketch of their entire operations from RM receipt to despatch. This was the scope of the study we defined in that meeting.
They said the diagram was so clear for them to visualise how their processes were connected. Even though they use process flow diagrams in their ISO manuals, this made more sense as it cut across departments.
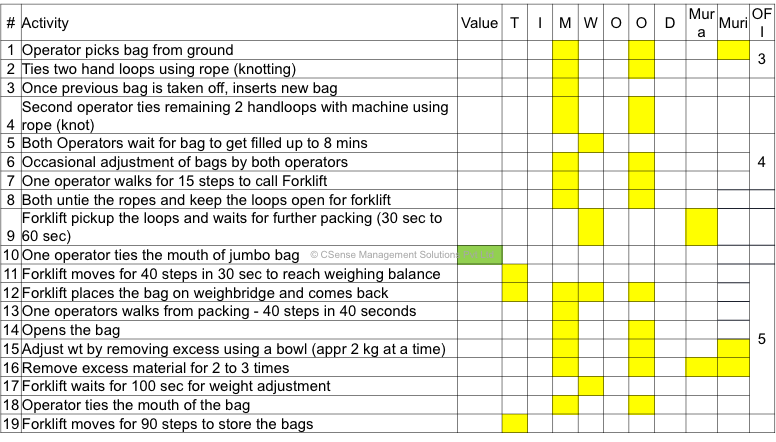
I wanted to see the flow again and observe the 3 Mus and seven waste of inefficiencies. I gave a list of data required by the end of the day to Mr Vishal, a junior engineer assigned to support the study with backend coordination.
Spaghetti analysis
I explained the spaghetti study in the Managers meeting. Mr Ramkrishna took printouts of the process flow diagrams we made and the block diagram of the plant and accepted to accompany me in the study.
We started walking through the plant using the process flow diagram as a route map. We counted our steps as we walked and marked our route on the block diagram with the number of steps we counted, the number of turns we took, and the number of material hand-offs.
This study will reveal the transport waste and over-processing waste out of 7 Wastes of TIMWOOD.
We walked across all the processes, including RM sampling, Packing material stores and engineering sections, then to the weighing bridge, to the office and finally to the exit gate. It took the entire second half. Our legs started to pain as we walked a few kilometres within the factory with the safety shoes.
I spent that early evening analysing the data I received from Vishal and got some insights about their cost, inventory and monthly plans.
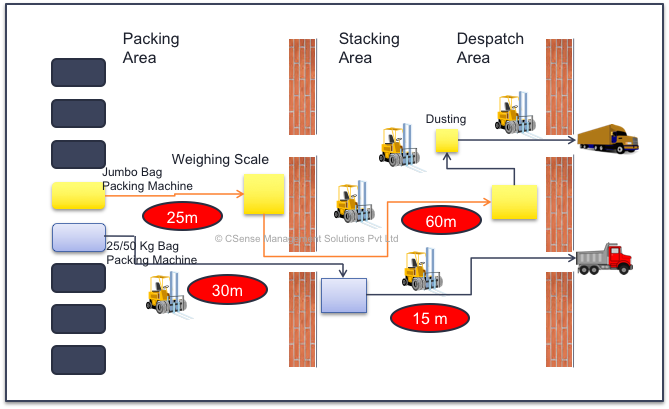
Spaghetti Analysis of Packing Section
Packing and blending sections are the major contributors to their production cost. The number of material handlers – the forklift drivers, truck drivers, stackers constituted nearly two-thirds of their labour strength.
Diesel expenses for the forklifts and trucks were also high.
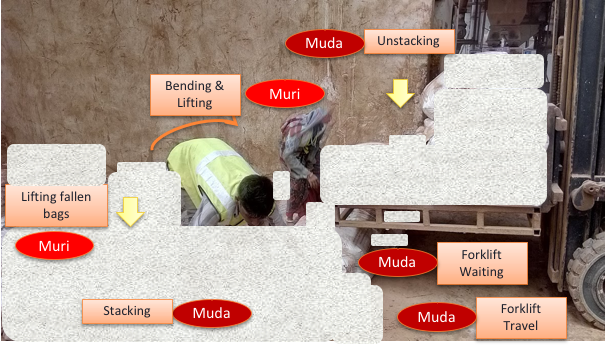
So, I focussed on the packing section and drew the spaghetti the next day.
The one-ton bags were moved 85 meters on an average from packing machine to despatch. The bags were handled 11 times in their journey. The smaller bags travel a total of 45 metres and touched 9 times between packing to despatch.
In terms of Kaizen, most of them are wastes – activities that consume resources but do not contribute to value addition.
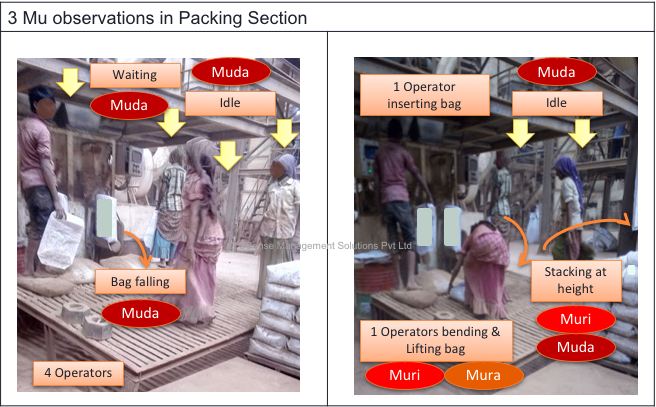
3 Mu Observation
Then I conducted the Kaizen observation of 3 Mus in the packing section. I recollected my Kaizen Guru’s words, “When you don’t know what to improve in a shop floor, just go and observe the Mus.” That’s what I did.
Also constructed a detailed list of wastes in the packing section. A sample of a 1-ton bag packing section is shown here.
I continued to conduct the spaghetti analysis across all the sections, observed the Mus and done detailed data analysis.
Value Stream Analysis
As I dig deep into observation and analysis, I was able to see a lot of inefficiencies, which were not visible to ordinary eyes. We are conditioned to accept what we regularly see as normal. So, they could not identify the areas for improvement.
I was thinking about ways to convince the plant people that there were opportunities to improve efficiencies and optimise the cost further. Similarly, I had to communicate the situation correctly to the corporate office. It was not that the plant was operating with excess people or that they were inefficient. The outcome of the time and motion study would be transcribed into such a decision. But I know the solutions; we use the Value Stream Mapping to capture the inefficiencies due to the process design and to present the opportunities for improvements in the right way.
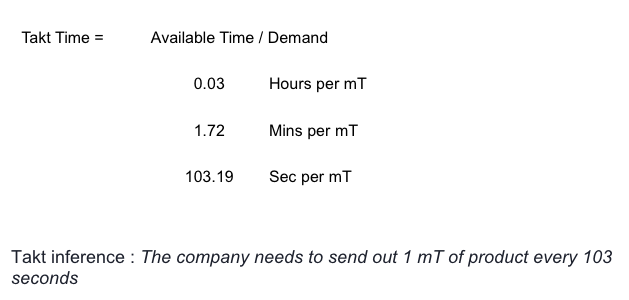
The Takt Time Calculation
Takt is a German word meaning Conductor’s Baton. Takt time is the time provided by the customer for completing the process of one order at a supplier’s facility. It is also called the customer demand rate or demanded exit rate. It is used to match (synchronise) the manufacturing/service processes to meet customer demand.
Value Steam Map
I collected the essential data and constructed a Value Stream Map of the process. Created a detailed value stream map and showing a gist here.
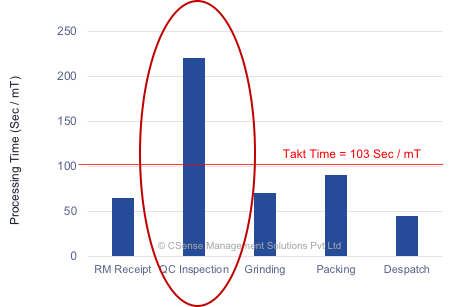
Cycle time balancing graph
The graph showed that the QC inspection was their bottleneck, affecting their flow of material and contributing to an increase in the inventory levels.
It was a surprise for everyone, including me. We studied their capacity utilisation a day before and found none of their processes was underutilised, and none showed signs of being a bottleneck. We were not sure at that time why the capacity utilisation was less in most sections. VSM gave us the answer.
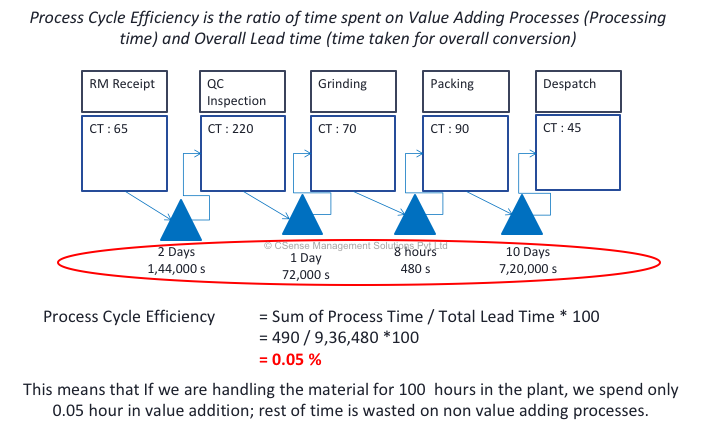
Process Cycle Efficiency
The process cycle efficiency was only 0.05%.
This gave me an excellent grip to convince people at the plant that the inefficiency was not their fault, and it was an opportunity to improve further. Once we know the right questions, we will get the correct answers.
Solutions
We conducted brainstorming sessions with Managers, followed by meetings in Gemba with the Operators to discuss the 3 Mus observed with detailed photographs and descriptions and moved towards potential solutions.
The proposals for solutions poured in.
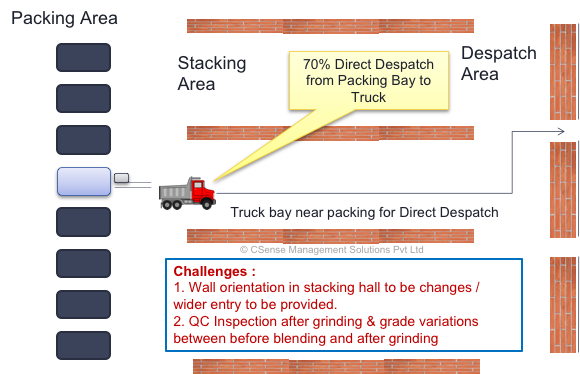
Direct Despatches
The breakthrough was an idea of ‘direct despatches’ from packing. They had space for trucks to come in. While analysing their monthly production and despatches data, We found that 70% of the materials despatched in one month matches with their monthly production plan. If they could plan a bit more in detail, they could accommodate 50 to 60% of their total production in direct despatches. So They could eliminate the need for stacking, transporting through the forklifts and unstacking and the entire cycle for despatch.
The Plant Head said that they already got approval and budget for the expansion of their warehouse. But, with this proposal, they would not require that additional space and could get support for the changes quickly.
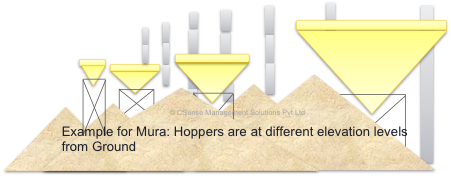
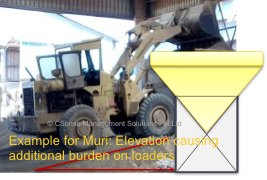
Proposal for Lowering the hopper levels
The Mus observations showed that the height of the RM feeding hoppers was uneven. They kept the hoppers at the elevation of 10 to 20 feet above the ground level (for no apparent reasons). Due to this height, the loaders took more fuel to climb and to carry material.
The Maintenance manager proposed that he could modify the angle of belt conveyors that collect the RM from the hopper, and hence, he could bring down the height of hoppers to a maximum of 4 to 6 feet above the ground level. He said this would reduce fuel consumption at the RM yard by around 20%.
Proposal for splitting the RM inspection to RM Yard
Interestingly, the Spaghetti analysis showed that QC people walk for more than 5 kilometres in a shift to collect RM samples. They proposed to shift the RM sample collection and analysis part of the QC lab to the RM yard itself. This would also save much time that was being wasted to call the QC from RM yard informing them about the receipt of vehicles and waiting for them to come and collect samples.
Debottlenecking the QC
Many initiatives came from QC as more people started focussing on bottleneck activities. It was found that QC analyses more than 600 external samples a year. One of the lab tests conducted on their finished goods would generally consume a whole shift of a chemist. QC people identified several more Mus, and they came out with implementable solutions.
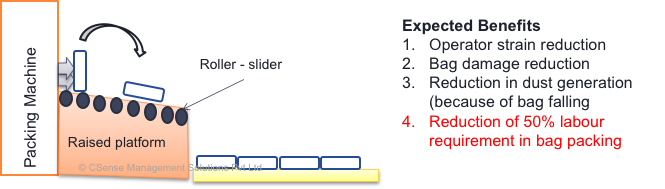
Improvement in packing
The small bag packing section came out with a simple roller table to reduce the waiting waste, muri and waste of defects due to bags falling from the packing machine.
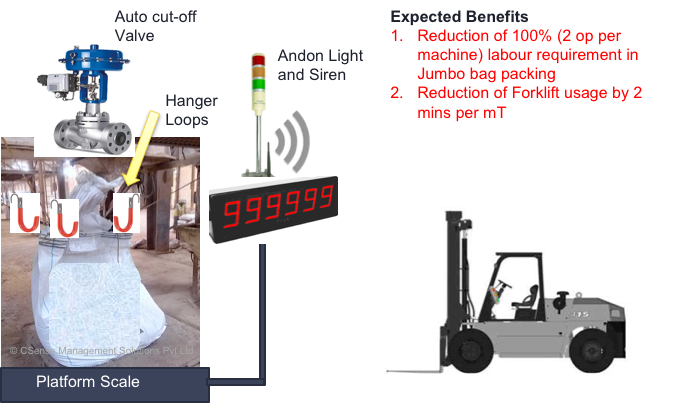
One-ton bag packing section proposed to use hooks instead of tying ropes and an andon system with a weighing balance.
More opportunities
Observation of Mus came from all the corners of the company,
Waiting in despatch is to find out the right truck because the ERP does not allow the Marketing people to enter the truck number,
Longer time (over-processing) for RM sample collection, because QC was not available at the time of unloading the material,
Over-processing of attendance and leave registers with multiple entries,
Waiting for 35 drivers from the start of office, 9.30 am to end of office at 6.00 pm. HR manager announced that he spoke with the drivers and explained about the Mus. The drivers agreed to help in administrative, logistic, canteen and gardening works.
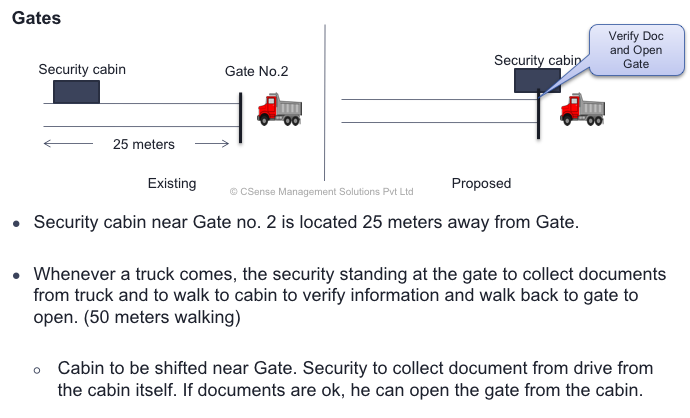
The security manager came out with a proposal to shift the Gate 2 cabin to reduce 50 meters of his security personnel to collect documents from each truck.
The game was not over
Within a few weeks after the study, I got a call from Mr Vinay and congratulated me. He said he was waiting for the results. He also said the Plant head had presented the plans to the CEO and got all his proposals approved. They had implemented many of the solutions. The CEO is planning to visit the plant in a couple of weeks along with some directors.
He had arranged a knowledge sharing session for all the plant heads of their group in the coming week and requested me to be a co-presenter and the Plant Head.

 By admin
April 20, 2020
By admin
April 20, 2020