What are statistical tools?
Statistics is a branch of science that deals with samples, measurements, calculations and estimation of population properties.
Statistical Process Control
Statistics found its application in manufacturing way back in the 1920s with Dr Shewhart of Bell Laboratories. We acclaim him for his application of Statistics in Manufacturing Science to predict when the process will produce a defect.
From there on, the application of statistics in manufacturing spread across the world and became instrumental in the Japanese Quality Revolution.
According to Dr Shewhart, there are only two mistakes the people in manufacturing are doing –
- Reacting when they are not supposed to react and
- Not reacting when they supposed to react
i.e., there are two types of deviations happen in any process. One being inherent variations (aka, common cause variations) of the process. And the second is variations happening due to some unique disturbances (aka assessable causes or special causes).
He recommended using the statistical process of differentiating between these two types of causes. To simplify the differentiation, he used control charts for the same.
7 QC Tools
When Dr Deming and Dr Juran visited Japan in 1951, they instilled a culture of data-based quality improvement. Dr Deming introduced process flow diagrams, other basic graphical tools. At the same time, Dr Juran taught tools Pareto charts. Similarly, industry experts in Japan had devised tools like cause-and-effect diagram (Dr Ishikawa), why-why analysis and more.
Statistics and Six Sigma
Statistician Bill Smith with the help of Dr Michael Harry developed a problem-solving method based on statistics in Motorola. Processes can benefit by reaching a quality level of 99.99967% of acceptance through applying this statistical methodology. This level of quality is denoted as sixth level in Sigma Scale.
Bob Galvin, the then CEO of Motorola named the method after its result, i.e., Six Sigma Methodology.
Six Sigma methodology is a framework that uses the best practices of project management, principles of statistics and best practices of statistical and improvement techniques.
We frequently use below Statistical techniques in Six Sigma methodology.
- Sampling – sampling methods and then size,
- Data Collection and Visualisation,
- Screening of Data,
- Stratification – using QC tools,
- Measurement System Analysis,
- Stability of process – using control charts,
- Process capability measurements,
- Comparison of multiple data sets,
- Establishing the relationship between two or more variables,
- Utilising control charts to control the parameters after improvement.
Application of Statistical Tools
Now we have a plethora of statistical tools, and we have an ocean of know-hows in the repository.
But I frequently see that process experts getting overwhelmed by the tools. And sometimes, we end up applying the wrong tool. Even worse, we expect tools to give us more information out of the intended scope.
We need to remember, that every tool is developed for a defined purpose. And hence, they work well only when we use them correctly.
Many a time, people ask me is there a ready reckoner for beginners as well as experts.
Tools are tools!
Tools are tools; They benefit the user depending on how rightly he uses them and how well he uses them. So, I am sharing the Application Matrix.
This matrix talks about the tool, its intended purpose of application and the outcome we can derive from it. And it clarifies when to apply the tool and prerequisites.
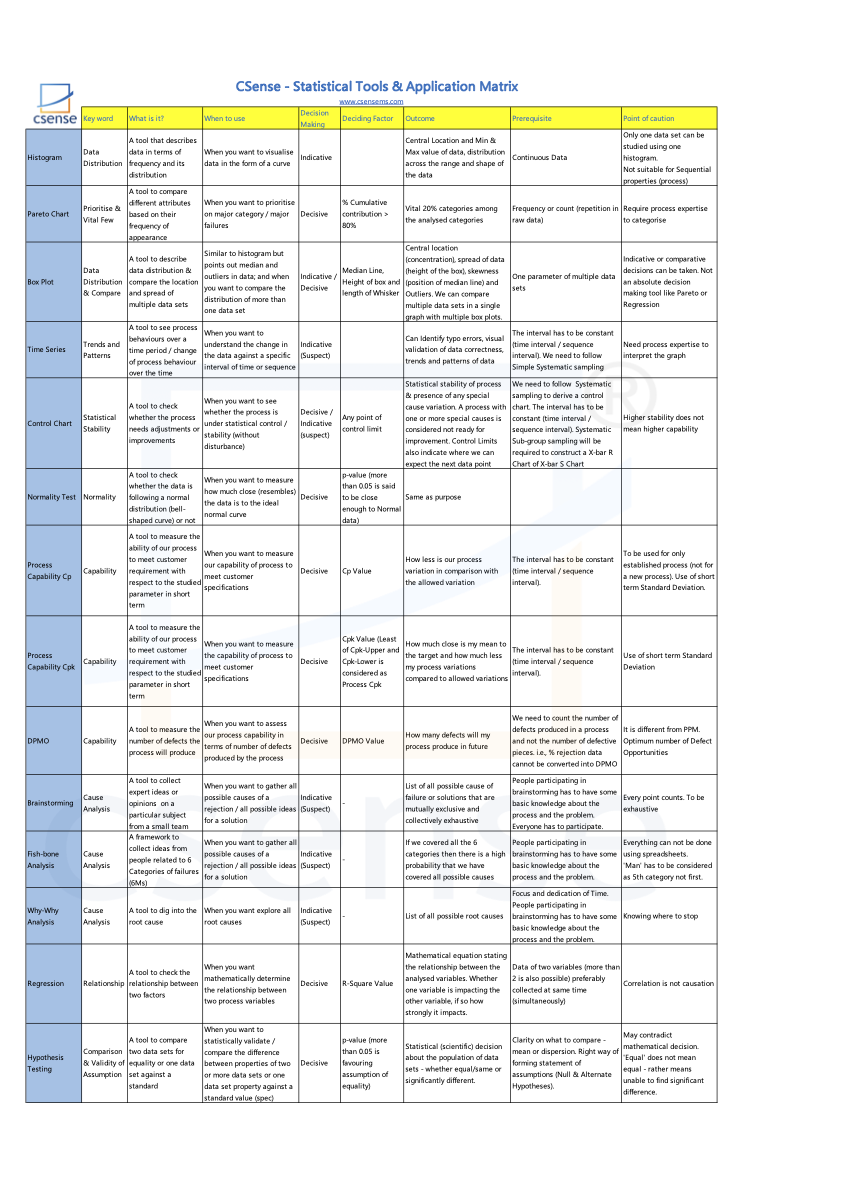
Statistical Tools – Application Matrix
Statistical Tools Application Matrix.csv
| Key word | What is it? | When to use | Decision Making | Deciding Factor | Outcome | Prerequisite | Point of caution | |
|---|---|---|---|---|---|---|---|---|
| Histogram | Data Distribution | A tool that describes data in terms of frequency and its distribution | When you want to visualise data in the form of a curve | Indicative | Central Location and Min & Max value of data, distribution across the range and shape of the data | Continuous Data | Only one data set can be studied using one histogram. Not suitable for Sequential properties (process) |
|
| Pareto Chart | Prioritise & Vital Few | A tool to compare different attributes based on their frequency of appearance | When you want to prioritise on major category / major failures | Decisive | % Cumulative contribution > 80% | Vital 20% categories among the analysed categories | Frequency or count (repetition in raw data) | Require process expertise to categorise |
| Box Plot | Data Distribution & Compare | A tool to describe data distribution & compare the location and spread of multiple data sets | Similar to histogram but points out median and outliers in data; and when you want to compare the distribution of more than one data set | Indicative / Decisive | Median Line, Height of box and length of Whisker | Central location (concentration), spread of data (height of the box), skewness (position of median line) and Outliers. We can compare multiple data sets in a single graph with multiple box plots. | One parameter of multiple data sets | Indicative or comparative decisions can be taken. Not an absolute decision making tool like Pareto or Regression |
| Time Series | Trends and Patterns | A tool to see process behaviours over a time period / change of process behaviour over the time | When you want to understand the change in the data against a specific interval of time or sequence | Indicative (Suspect) | Can Identify typo errors, visual validation of data correctness, trends and patterns of data | The interval has to be constant (time interval / sequence interval). We need to follow Simple Systematic sampling | Need process expertise to interpret the graph | |
| Control Chart | Statistical Stability | A tool to check whether the process needs adjustments or improvements | When you want to see whether the process is under statistical control / stability (without disturbance) | Decisive / Indicative (suspect) | Any point of control limit | Statistical stability of process & presence of any special cause variation. A process with one or more special causes is considered not ready for improvement. Control Limits also indicate where we can expect the next data point | We need to follow Systematic sampling to derive a control chart. The interval has to be constant (time interval / sequence interval). Systematic Sub-group sampling will be required to construct a X-bar R Chart of X-bar S Chart | Higher stability does not mean higher capability |
| Normality Test | Normality | A tool to check whether the data is following a normal distribution (bell-shaped curve) or not | When you want to measure how much close (resembles) the data is to the ideal normal curve | Decisive | p-value (more than 0.05 is said to be close enough to Normal data) | Same as purpose | ||
| Process Capability Cp | Capability | A tool to measure the ability of our process to meet customer requirement with respect to the studied parameter in short term | When you want to measure our capability of process to meet customer specifications | Decisive | Cp Value | How less is our process variation in comparison with the allowed variation | The interval has to be constant (time interval / sequence interval). | To be used for only established process (not for a new process). Use of short term Standard Deviation. |
| Process Capability Cpk | Capability | A tool to measure the ability of our process to meet customer requirement with respect to the studied parameter in short term | When you want to measure the capability of process to meet customer specifications | Decisive | Cpk Value (Least of Cpk-Upper and Cpk-Lower is considered as Process Cpk | How much close is my mean to the target and how much less my process variations compared to allowed variations | The interval has to be constant (time interval / sequence interval). | Use of short term Standard Deviation |
| DPMO | Capability | A tool to measure the number of defects the process will produce | When you want to assess our process capability in terms of number of defects produced by the process | Decisive | DPMO Value | How many defects will my process produce in future | We need to count the number of defects produced in a process and not the number of defective pieces. i.e., % rejection data cannot be converted into DPMO | It is different from PPM. Optimum number of Defect Opportunities |
| Brainstorming | Cause Analysis | A tool to collect expert ideas or opinions on a particular subject from a small team | When you want to gather all possible causes of a rejection / all possible ideas for a solution | Indicative (Suspect) | - | List of all possible cause of failure or solutions that are mutually exclusive and collectively exhaustive | People participating in brainstorming has to have some basic knowledge about the process and the problem. Everyone has to participate. | Every point counts. To be exhaustive |
| Fish-bone Analysis | Cause Analysis | A framework to collect ideas from people related to 6 Categories of failures (6Ms) | When you want to gather all possible causes of a rejection / all possible ideas for a solution | Indicative (Suspect) | - | If we covered all the 6 categories then there is a high probability that we have covered all possible causes | People participating in brainstorming has to have some basic knowledge about the process and the problem. | Everything can not be done using spreadsheets. 'Man' has to be considered as 5th category not first. |
| Why-Why Analysis | Cause Analysis | A tool to dig into the root cause | When you want explore all root causes | Indicative (Suspect) | - | List of all possible root causes | Focus and dedication of Time. People participating in brainstorming has to have some basic knowledge about the process and the problem. | Knowing where to stop |
| Regression | Relationship | A tool to check the relationship between two factors | When you want mathematically determine the relationship between two process variables | Decisive | R-Square Value | Mathematical equation stating the relationship between the analysed variables. Whether one variable is impacting the other variable, if so how strongly it impacts. | Data of two variables (more than 2 is also possible) preferably collected at same time (simultaneously) | Correlation is not causation |
| Hypothesis Testing | Comparison & Validity of Assumption | A tool to compare two data sets for equality or one data set against a standard | When you want to statistically validate / compare the difference between properties of two or more data sets or one data set property against a standard value (spec) | Decisive | p-value (more than 0.05 is favouring assumption of equality) | Statistical (scientific) decision about the population of data sets - whether equal/same or significantly different. | Clarity on what to compare - mean or dispersion. Right way of forming statement of assumptions (Null & Alternate Hypotheses). | May contradict mathematical decision. 'Equal' does not mean equal - rather means unable to find significant difference. |