We have started analysing the causes of the inferior performance of Ben’s Pizza outlet in our story. We translated the business pain – customers don’t like the pizzas’ into multiple Six Sigma projects. ‘Temperature of pizza at the time of service’ is one such project.
In the earlier chapter, we covered the use of FMEA for listing out all potential causes. We will see the application of Fishbone analysis in this chapter.
Now
Ben, Anand, and I had a fun time during lunch. Anand was pulling Ben about something that happened during their ‘beach walk’ that week.
We resumed after lunch, and the ‘Pizza Temperature’ team was ready in the training hall. Everyone is enthusiastic.
We got 40 Suspected Causes
It was Pravin who jumped out of his seat as soon as he saw us and said, “We have got more than 40 suspected causes, Sir!”.
Without any challenge, Life becomes boring. When we face a challenge, we become a bit more alert, and life becomes interesting. When we overcome the challenge, we grow happy.
I thought to myself.
“That’s pretty good, Pravin” I said. “What is the learning?” I enquired.
“Sir, we came to know more about our process and also that we have more suspected causes than we thought”, said Abhishek.
“That’s fantastic, Abhishek and Well done, Team!” I said while glancing at Ben.
“Yes, that is really an excellent job, guys! Even I was not fully convinced that we could touch forty suspected causes. But it’s just the start,” he said, with a few fumbles.
So, what is next?
“Now, we have got 40+ causes, Kannan. They are happy about it. But Anand and I feel we… we still miss something. With due respect to the team’s work, we are not confident about the list of suspected causes. Our worry is, – Is it exhaustive? Are there some more blind spots?” said Ben.
He looked at his team and continued, “I know, you would have something to help this situation”, he smiled.
I smiled back with a pinch of sarcasm.
“Yes, I understand. You are trying to push me to the next step.
We have the next tool. This is one of the most important tools and part 7 QC tools. We are going to utilise ‘Fish-bone Analysis’.
Fishbone Analysis
After seeing confused faces, I wrote the name on the board. Then, finally, I saw their confusion slowly vanishing, and they start looking at each other smile.
“Sir, seriously is it called Fishbone? I thought I heard it wrong,” said Abhishek.
“Yes Abhishek, it is called Fishbone analysis” I said.
Then they laughed aloud.
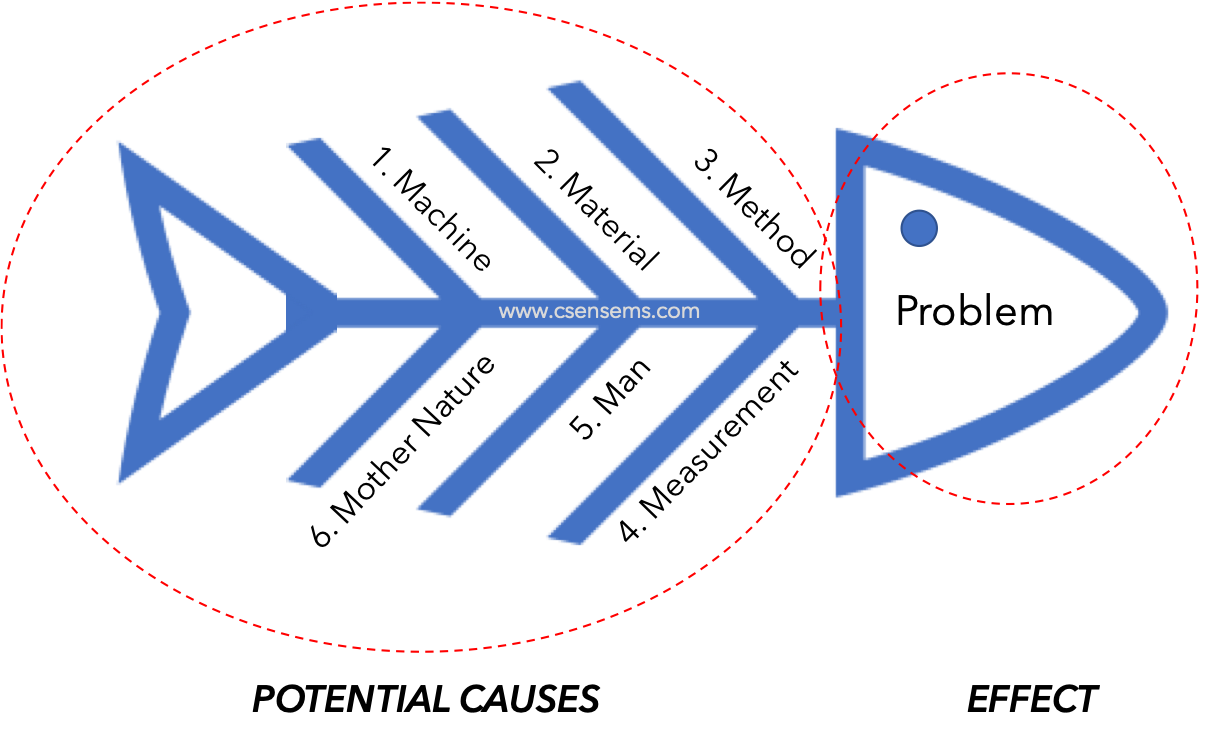
Then I showed a picture from my laptop.
“Can you see a fish in this picture?” I asked them.
“Yes” was their answer. “Sir, I can see the bones as well,” said Abhishek.
“This is called Cause and Effect Analysis, Fishbone Analysis or Ishikawa Diagram,” I said.
“Ishikawa” they echoed.
“Yes, named after Professor Kaoru Ishikawa, who has created it”. I said.
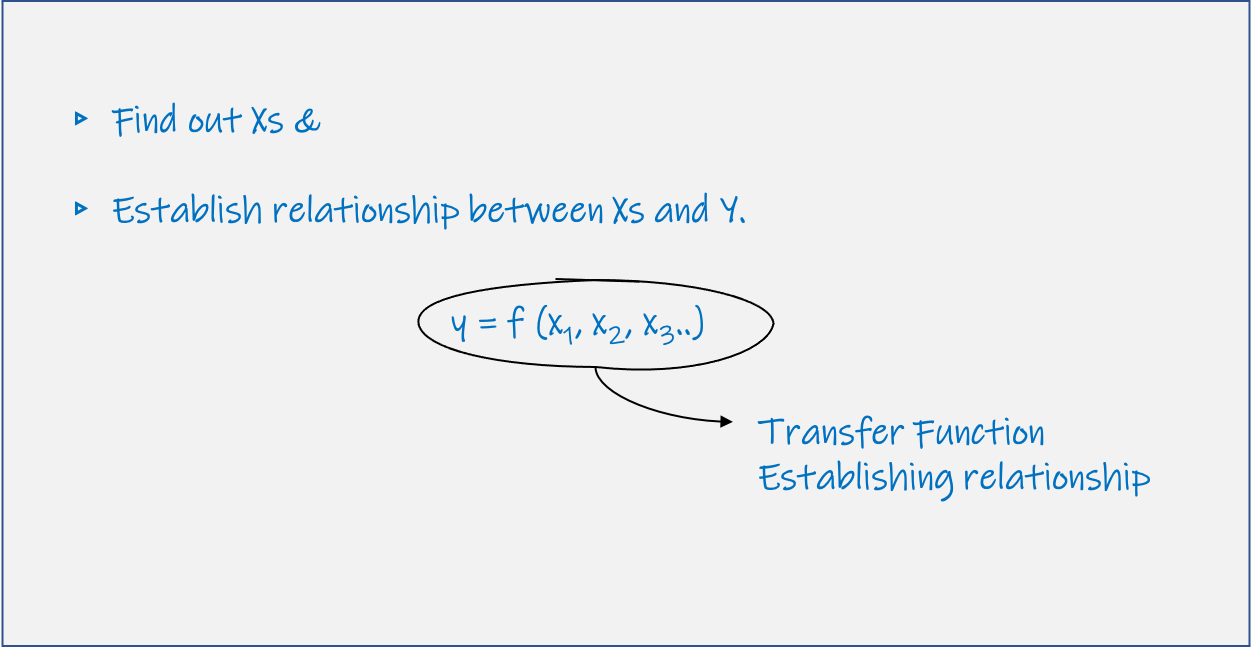
Six Sigma Transfer Function
“Do you remember the Transfer function, y=f(x) we discussed during define phase?” I asked.
I was wondering ‘what happened to them? They keep laughing throughout the post-lunch session’ and waited for them to calm down.
“Do you remember the purpose of Analyse phase?” I asked.
“Finding out the factors that affect our project y and establish their relationship,” said Ravi.
“Wonderful, Ravi” I said and wrote on the board.
In this phase, we are trying to establish a relationship between the factors – Xs and the problem – project y. What kind of relationship these two factors are having?” I asked, and simultaneously shown them a slide from the laptop.
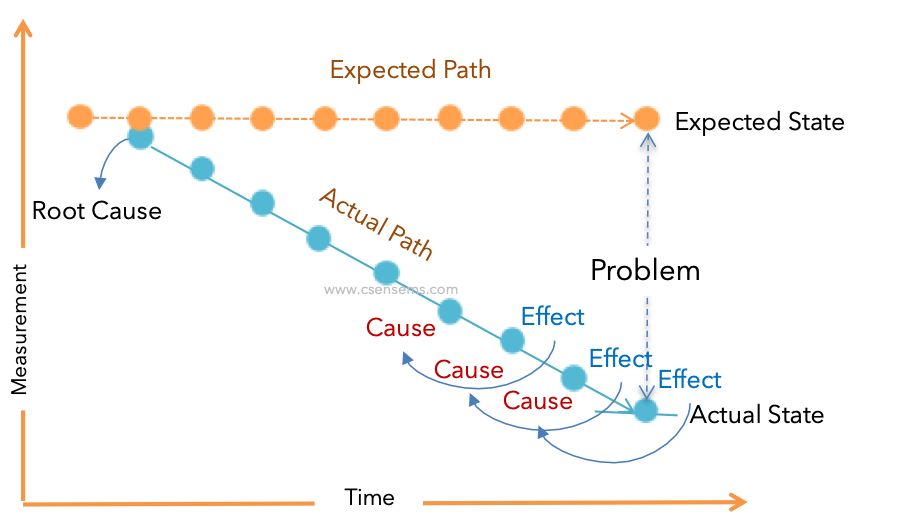
Cause & Effect Relationship
“Look at the picture. Here, we can see the problem or otherwise the project y, as the gap between Expected State and the Actual State. Now, tell me why there is a gap?”
Ravi responded, “Sir, the amber dots are the expected path of the process. The process had drifted at a point and then followed the path of blue dots – the actual path. So, when we measure at a later point in time, we see the gap”. He took a gasp and looked at me.
“That’s great, Ravi! Please calm down and continue,” I said.
“Each of the blue dots is caused by a preceding blue dot. So, the entire linage of such dots shows a relationship with its succeeding dot,” he completed.
“Ravi, that’s a fantastic understanding!” said Ben. Now I could see the relationship between the problem and the suspected causes.
Until now, we have found out various blue dots that could have resulted in our actual state of the temperature of pizzas that is lesser than the preferred temperature. As you pointed out in the picture, these dots have a relationship.”
I intentionally interrupted, “This is called the cause-and-effect relationship” and gestured Ben to continue.
“So, we need to go deep and find out where exactly the process has drifted. That is what is called a Root Cause,” he said with pride of an inventor.
I really liked it and that is what the felling I wanted to create.
Purpose of Fishbone Diagram
He continued, “Even in our personal lives, we tend to attend to the effects and try to solve them. So, matters become complicated. When we try to look at the ultimate cause, we can easily solve the problem with much lesser effort. Life becomes simple”.
I thought to myself,
When a person learns a technique, he tries to apply it everywhere and makes things complicated. But, once he understands the tatparyam or the intent of it, he becomes enlightened.
I said, “Hey, come on, Ben. We see someone becoming a Guru now and then in our sessions”, and the hall filled with lighter moments of joy.
“That’s what the purpose of the Fishbone diagram is. It helps us first list down all the suspected causes and guide us in finding out the root cause. The beauty of the tool is that it makes thinking easier by splitting it into categories”.
The 6Ms of Fishbone
I continued, “Another beauty of the fishbone analysis is that it has classified the cause categories into 6. There is a strong belief that these six categories encompass all the potential causes of the business world. Therefore, we do not need a seventh or eighth category.
These six categories are also called 6Ms: Machine, Material, Measurement, Method, Man and Mother Nature”.
“Kannan, how would it work for us?” Ben jumped in and I understood the reason.
“Yes, Ben.
We are going to identify a big board or a wall to draw a mega-sized fishbone.
We assemble as a team, as we did for the brainstorming.
I would write the problem in the fish head potion.
The convener would guide the team to brainstorm on ‘how could a particular category cause the problem’. For example, in our case, I would start asking ‘how could a machine cause the temperature of pizzas to go down?’ and fill up the ‘Machine Bone’ in the fishbone diagram.
The answers would be written as a sub-bone under its category. These answers are called Potential Causes.
Once the team is convinced that all the machine-related problems are exhausted, we would move on to the next category.
Thus, we would complete all six categories.
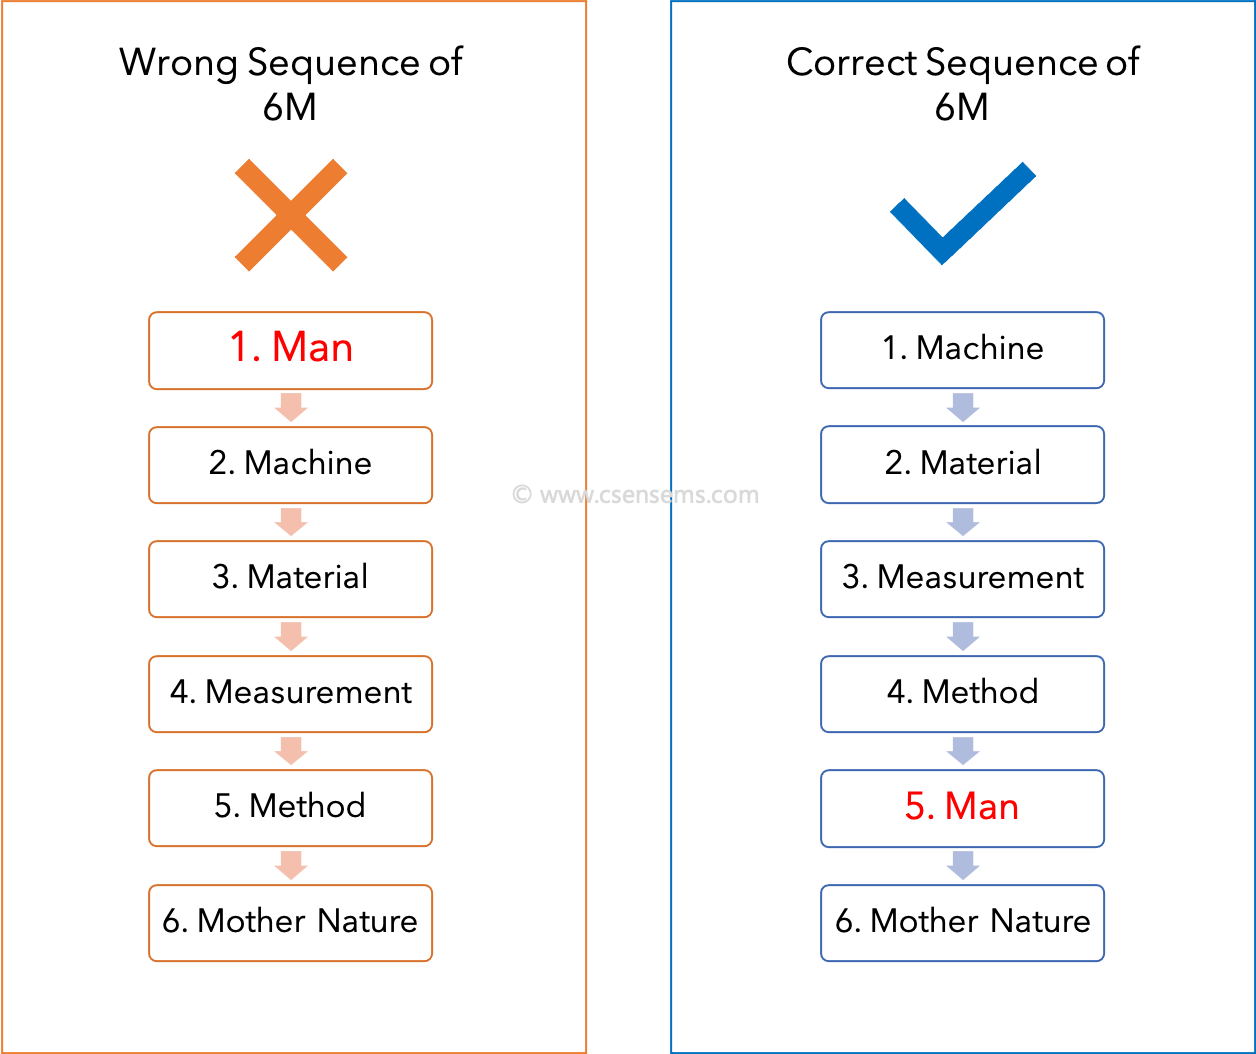
The Sequence
“Kannan, I see you are cautious about mentioning them in sequence. Anything special?” asked Ben.
“Yes, Ben. The success or failure of this tool is highly dependent on the sequence. People commonly say the 6Ms, as ‘Man, machine, material…’. But it is a sure-shot failure recipe.
Before we try to solve a problem, we must understand that a man can never be a root cause of a problem, and if your root cause is a man, you can never solve that problem.
So, I consciously use the ‘Machine, Material, Measurement, Method, Man and Mother Nature’ sequence.
My Guru use to say,
No man comes to the office intending to do a bad job. No operator comes to the factory intending to break a machine or to make a defect. If at all he had done something wrong, it could be a mistake. We must look at the system that allowed him to make a mistake.
I showed a picture on the projector to emphasise the point.
The correct sequence of brainstorming using Fishbone Technique
Mother Nature
“Sir, what would come under the category of Mother Nature? Because when you say a human cannot be a cause, how come mother nature can harm us?” asked Abhishek with a blank face.
I knew, his blank face means mischief!
“Yes, Abhishek, a good question!” I said while paraphrasing the answer in my mind.
“Here, we could have problems which are beyond the scope of the 5 Ms and not covered yet. There could be some factors that affect our processes and that are beyond our control.
For example, in our case of ‘temperature of pizza’, the ambient temperature could be a potential cause. When the outside temperature is very low, the pizzas might become colder soon. However, we can’t add this cause under any of the other 5 categories. Hence, this falls under the sixth M.
This category stands for the causes that are clearly out of our control or unpredictable. To construct the categories under Ms, we call it Mother Nature. We can call it Miscellaneous if you don’t want to blame mother nature.
We laughed and Abhishek’s smile accompanies with a sigh and a sense of accomplishment.
Root Causes
I continued after taking a few seconds of rest, “The concept of fishbone is that there are only 6 categories of potential causes. Hence, if the team is confident that it has covered all the 6 categories exhaustively, we can say that we collected the exhaustive list of potential causes”.
“In this way, we can call the fishbone analysis as a ‘Structured Brain-storming technique’ or ‘Sequential Brainstorming technique’.
“Kannan, how can we reach the root cause from here?” asked Ben.
“Yes, Ben. The next step is finding out root causes” I replied.
“Ok, are we going to use this fishbone diagram to find out root causes? Or…” he paused for a moment. And continued, “Because I saw a different table kind of template for root cause analysis when you showed me a case study”.
Before I could answer, the door was knocked and opened slowly. The aroma of a freshly brewed coffee entered the room before everything else.
Then Anand, who opened the door and holding it to help person with coffee, entered the room.
I looked at the clock. It was 4.02 PM. I showed a thumb up to Anand with a smile.
He winked and smiled as if it was his duty to take care of us.
Next
We will discuss the utilisation of this wonderful tool – fishbone analysis – in finding out root causes and the help of ‘why-why analysis’ in the coming chapter.

 By admin
December 25, 2020
By admin
December 25, 2020