Advanced Problem Solving Methodologies – Design of Experiments – DoE
It was a hot summer and I was travelling through the deserts of Western India. A wonderful piece of land with varying lifestyles every few hours of drive. I eagerly looked at the domesticated camels and started thinking about how things happened so quickly and how did I manage to plan my trip to that well-known cement factory for a DoE engagement.
A week before –
I received a call from Mr Dwivedi. He introduced
himself as the Head of Quality Assurance of a well-known cement manufacturer.
He required my support in solving their longstanding quality complaint. I
wanted to have more details and proposed him a detailed con-call that evening.
But he said that he wanted to solve the issue at the earliest and just wanted
my confirmation whether I can support, and available in the coming week.
I said ‘Yes’ to both and he got our engagement
formalised and got my travel arranged in a couple of days. I met their Director
and HoDs of Marketing and Processing.
The Business Problem
From the discussions, I understood –
They are in the cement business for the past 2 decades and have a huge inventory of captive mines to supply their raw materials. The plant capacity was never a constraint as they built it for the future. Their market promotions are effective. The Director also showed their sponsorship campaign associated with cricket league. But yet, they were unable to reach their full market potential in recent years. This is because they could not achieve a specific property of cement up to the expected level.
He said, “we could not meet the slump property of 120
mm at 3 hours. This keeps up away from winning the markets of Ahmedabad and
Mumbai”.
Slump property
Modern-day construction relies heavily on premix concrete. The concrete is prepared at a distant location and sent to the construction site as a premix. We know cement will become solid once it is mixed with water. But the cement used in the concrete premix is expected to remain flowable (that is, it should not become solid) for 100+ minutes. This time gap is to accommodate the time required for thorough mixing, filling up of premix containers, transporting the container from the mixing site to the construction site and pumping the concrete to the required location of the building (say to the nth floor of a high-rise).
The flowability of the cement is measured using a test called the slump test. In this test, a mini-batch of concrete is prepared in the laboratory. The concrete is filled in a bucket-shaped apparatus and allowed to settle for a certain time (say 60 minutes, 120 minutes, 150 minutes or 180 minutes). Then the bucket is toppled after the settling, and the concrete will be allowed to collapse. The height reduction after the collapse is measured as ‘slump height’ and represented as slump property of cement. It is usually mentioned as 100 mm at 1 hour or 90 mm in 2 hours etc.
Trials have failed
The Head of Processing (Mr Rameshwar) and the Head
of QA (Mr Dwivedi) took me to the laboratory and showed the records of their
past trials. I was amazed at the number of trials they had conducted. They did
a marathon of more than 350 trials in the past 2 years.
Mr Rameshwar said in a desperate tone, “At the beginning of this financial year, our director has given March 31st as the deadline to solve the problem. We both were assigned with the task. We intensified our trials in the hope of finding a solution but ended in vain. He communicated his dissatisfaction with our performance during the recent quarterly review. He told us
‘if you keep doing the same process again
and again, you are going to get the same old results.’
And asked us to look for alternative methods and
that’s how you are here”.
Problems with Conventional Experimenting approach
We took a day to collect all their old trial data
which were scattered in their lab and in production records. After
painstakingly analysing the data, we were unable to establish any finding. This
is because either their trials were not properly planned, documented and
connected to corresponding results or in some cases, the data were not at all
captured.
They used to conduct the trials by changing one parameter, get some understanding and do consecutive trials with some modification. This is called the One Factor At a Time methodology aka, OFAT. They fixed the parameter at a certain value whenever they get a better value. Keeping a value of parameter based on better results is known as the Keeper’s strategy.
But they could not find out the right factors and their optimum levels.
DoE
I proposed to conduct the Design of experiments to arrive at the key factors affecting the slump property and their corresponding settings.
But, consider a case – at the end of your problem-solving analysis, you found out that there are 5 factors (Xs) that are affecting your outcome (y) and suppose those five factors are interdependent. If you increase one of the factors (say, temperature) the other factor (say pressure) increases. Then how do you identify the optimum setting?
In the conventional method, we use Trials in line with trial and error method or OFAT.
We already saw the shortcomings of this traditional experimentation model. Hence, we use the Design of Experiments (here, we discuss the basic model in DoE – the Full Factorial Model). DoE helps us to design the experiments with a minimum number of trials providing maximum insights. It reduces the impacts of human bias, unknown environmental factors (also called as Lurking factors) by adopting the concepts of replication and randomisation.
DoE Preparatory Study
We conducted a detailed brainstorming, Failure Mode and Effect Analysis and Fish-bone analysis of the complete process with respect to slump failure. From these analyses, we got an exhaustive list of possible causes in the process. Using the Risk Prioritisation Number or the RPN obtained from the FMEA, we prioritised top factors that impact the slump property.
Since their interest and expertise guided us to focus on the composition alone, we restricted our focus to the chemical composition and exempted the process parameters.
List of Factors
We arrived at the final list of factors that are affecting our response. These factors will be used in the design of experiments.
Further drilling down had shown that these factors
are falling in three distinct categories.
Additives
Chemical properties of cement/clinker
Concrete & its raw material
In order to reduce the number of trial runs and
complexity in the experimentation design, we agreed to conduct 3 sets of experiments
focussing on these three groups separately.
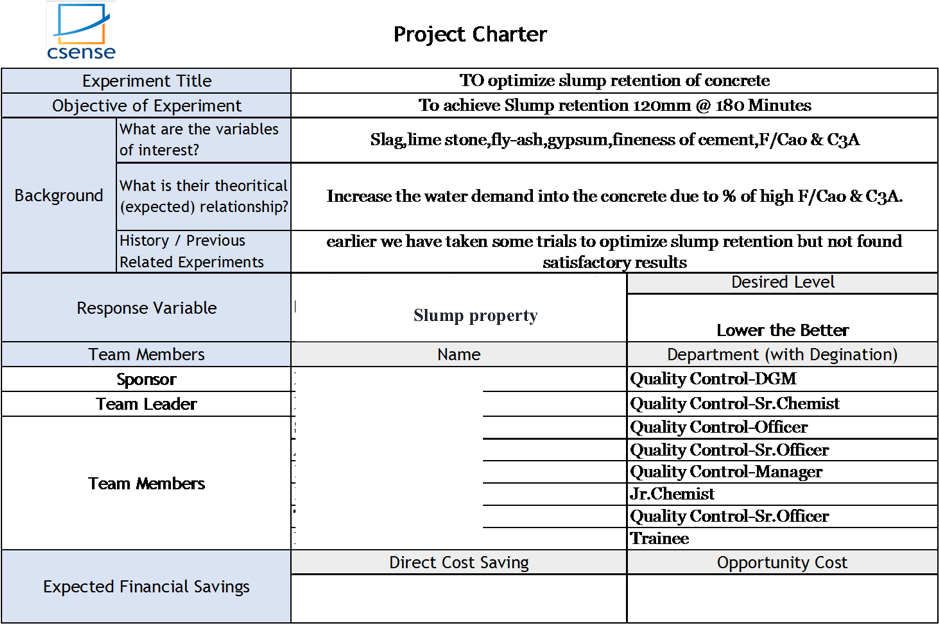
First DoE Experiment – with Additives
We prepare a project charter for the experiment
with the additives.
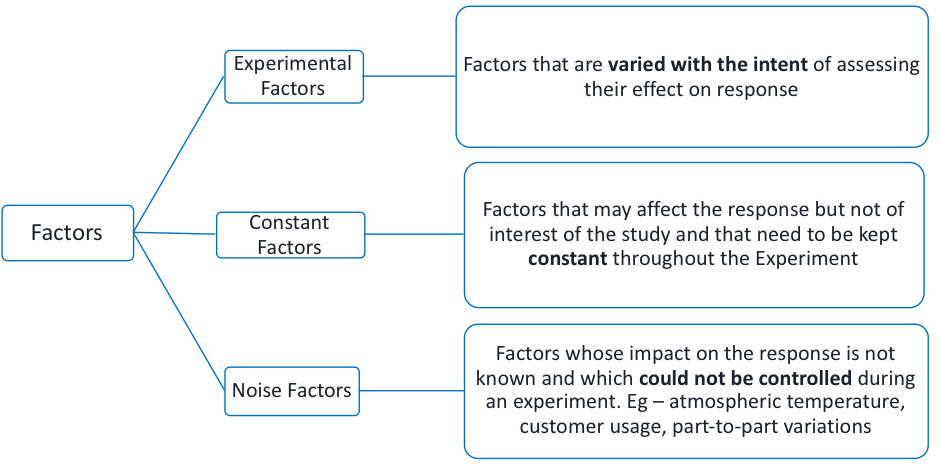
Generally, the factors in the process are
classified in to three.
Most of the experiments fail not because of the
experimental design but because of failure to control the constant factors and
track the noise factors. Hence, we assigned responsibilities to the team
members to ensure the constant factors are kept constant throughout the
experiment and keep a track of noise factors.
Experimental Factors
Constant Factors
Noise Factors (suspected)
We calculated the number of trials with the formula
of
Lf
Where L is the number of Levels (here it is 2) and f is the number of factors (four).
Replication & Randomisation
We used Minitab software to design the experiments and analyse the outcomes. I gave them the randomised experiment plan with one replication.
Randomisation is jumbling the sequence of the
trials in order to remove the bias and unknown environmental factors.
Replication is repeating the same setting again but at a different time period.
They had conducted the trials within 2 weeks and
called me again for further proceedings.
The results
But, this time the reception was very different.
People have moved from the mixed mood of curiosity + doubt to curiosity +
excitement. Before we start the session, Mr Dwivedi and Mr Rameshwar met me in
my room in their lavishly spacious guest house. Mr Dwivedi shook my hands for a
long time saying “I think we have made it. We have got very good results.
Everyone is waiting for your analysis.
I ensured the data collected is right. I was eager to see whether the constant factors and noise factors are rightly tracked and rewarded with a clue.
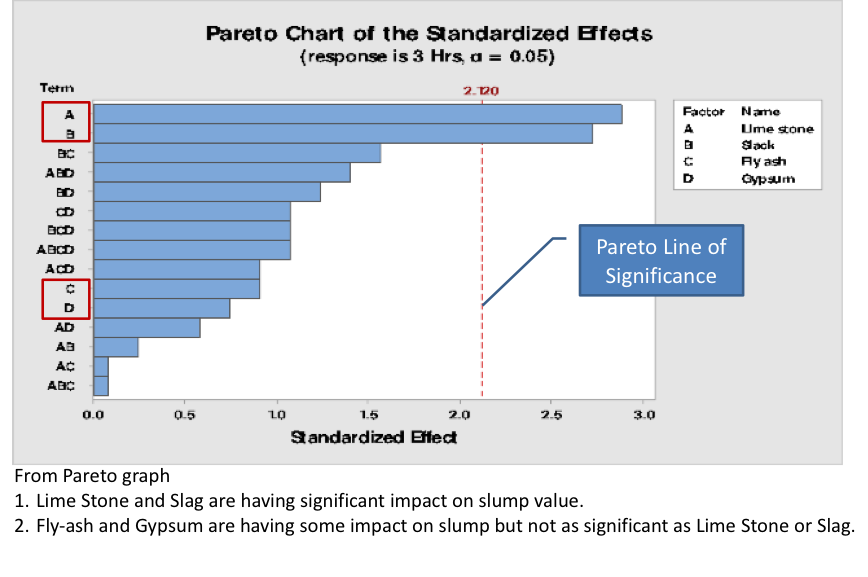
The Pareto Chart
Based on the response data collected, we have got
the following findings. The final derived Pareto Chart (the initial chart is
given in the picture) of DoE showed that components A and B were having a
significant impact on the slump property whereas components C and D were not
having a similar impact.
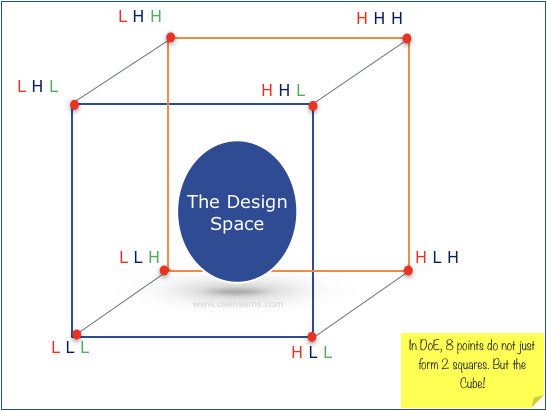
Cube Plot
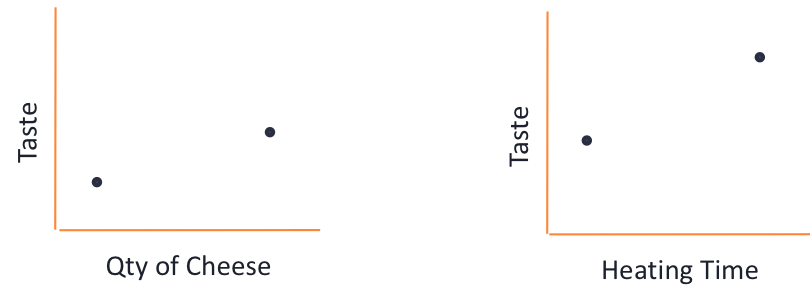
The beauty of DoE is in the statistical interpretation of the results. Consider an example of making pizzas. Will take 2 factors – Quantity of cheese added, and time of heating determines the taste.
As per OFAT, we change one factor at a time and
collect data. If you are allowed to run only 4 trials (L raise to the f will be
2^2 = 4), we will get the outcome as below from the data analysis.
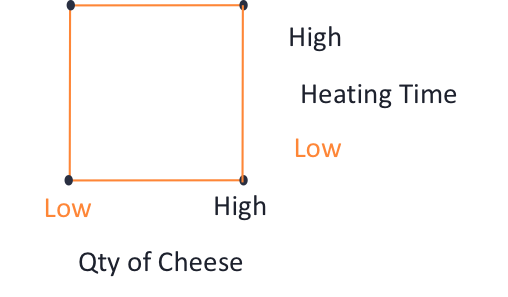
In case of statistically supported DoE analysis, we
get a square with these four readings.
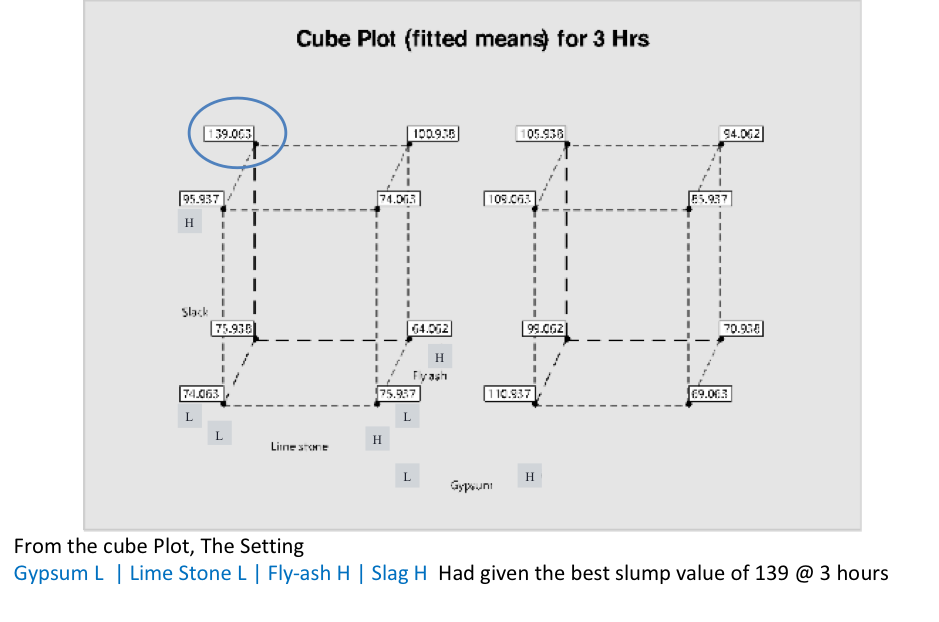
We can predict the outcome within the square with mathematical accuracy. We have got one of the better outcomes above the target value of 120 mm and consistent performances around 100 – 110 mm in the initial experiment.
I showed the cube plot and encircled the highest outcome. “Now, we need to conduct 2 confirmation trials with this setting,” I said. “Already we have conducted 3 tests and got 125, 125 and 130 mm” Mr Rajeshwar responded with a smile.
Further, we planned designs for the second experiment with the chemical properties and then the concrete mix in the third set of trials. We have got better results in both the experiments. The parameters were reconfirmed with confirmation trials and their level was standardised.
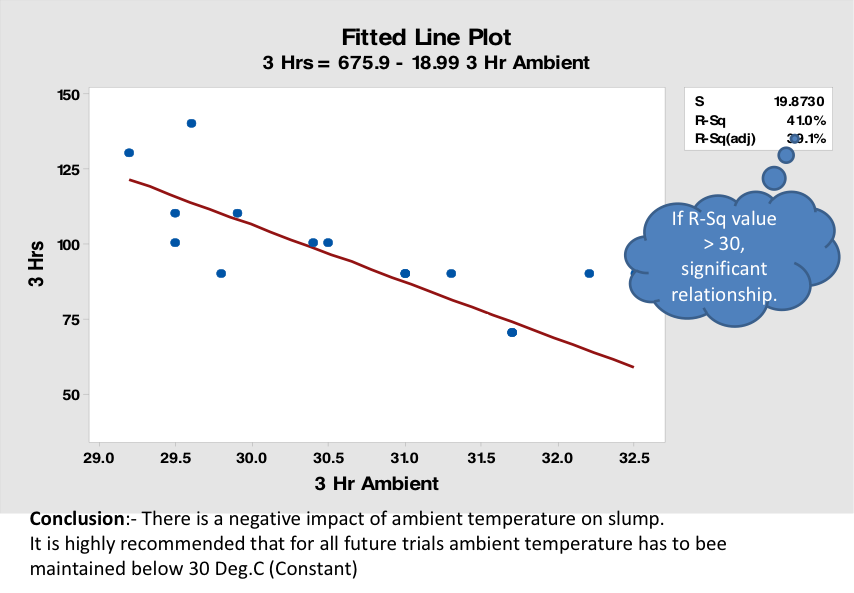
The clue from Noise Factor
Most importantly, we found out the negative impact
of ambient temperature on the slump property. This was the clue I got from
observing the data of noise factors and corresponding response readings. I
suspected that whenever the ambient temperature is higher, the outcome was
lower than expected. We have conducted a regression analysis which confirmed
the same.
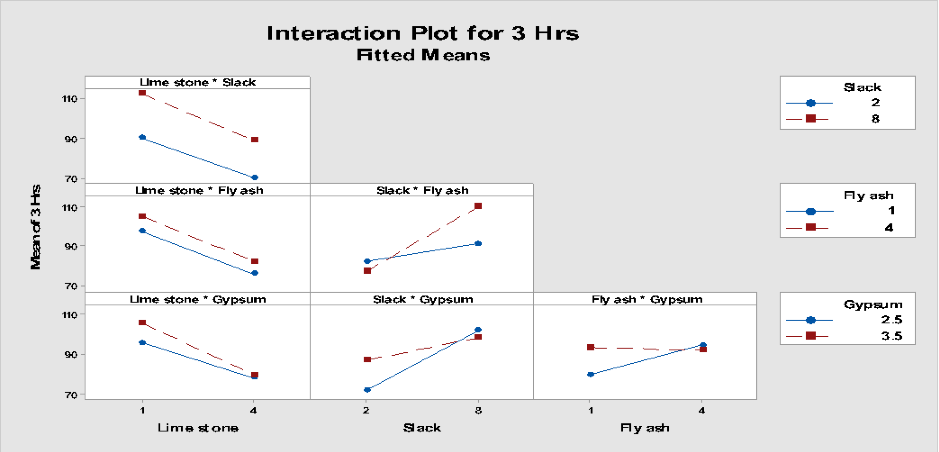
We also found the interaction effects – that is the
effect of one chemical upon another chemical’s impact.
Conclusion
We accomplished the goal; that too, well before time. Further confirmation trials with regular production have shown a consistent performance with the slump values. We derived further fine-tuning trials to optimise the quality, yield and the cost.
We had a memorable lunch at their guest house on that day. Mr Rameshwat told me to ensure all my luggage are intact. I checked and told him,
“My bags are full with immense learning, confidence and sincere wishes from the cement experts”.

 By admin
February 13, 2020
By admin
February 13, 2020