JMP, usually pronounced as ‘jump’, is a statistical data analysis tool that works well on MAC and Windows OS.
It is developed in 1989 by the SAS institute. Because of its user-friendly nature, people in Six Sigma, Design of Experiments, Statistical Process Control (SPC), research and development extensively use JMP.
JMP software focuses on exploratory data analysis and visualisation. It provides lots of features to easily and seamlessly switch between various visualisation tools on a single screen. JMP’s Graph Builder tool becomes very handy in doing so.
Users find it intuitive to build interactive visualisations and dashboards right away with JMP’s drag-and-drop interface. Then, they investigate and explore data and validate their explorations using hypothesis testing, data mining, or other analytic methods. In addition, discoveries made through graphical exploration can lead to a designed experiment designed and analyzed with JMP.
Data Analysis or is a statistics-based family of tools that we use to monitor, control, and improve processes, based on the either Six Sigma DMAIC or SPC framework.
Conceptually, it is applying the statistical technique to achieve control over the processes to improve their reliability and predictability.
The training program is comprehensive training for engineers, supervisors and middle-level managers to clarify statistical concepts and know-how of data analysis tools and techniques using JMP.
CSense experts have designed this workshop to cover the statistical tools used in different stages of Data Analysis.
Data Analysis using JMP – Course Content
Understanding basics of Statistics
Central tendency
Dispersion of data
Populations and Samples
Descriptive and Inferential Statistics
Understanding the Measurement System
Variations in Measurement Systems and analysing it
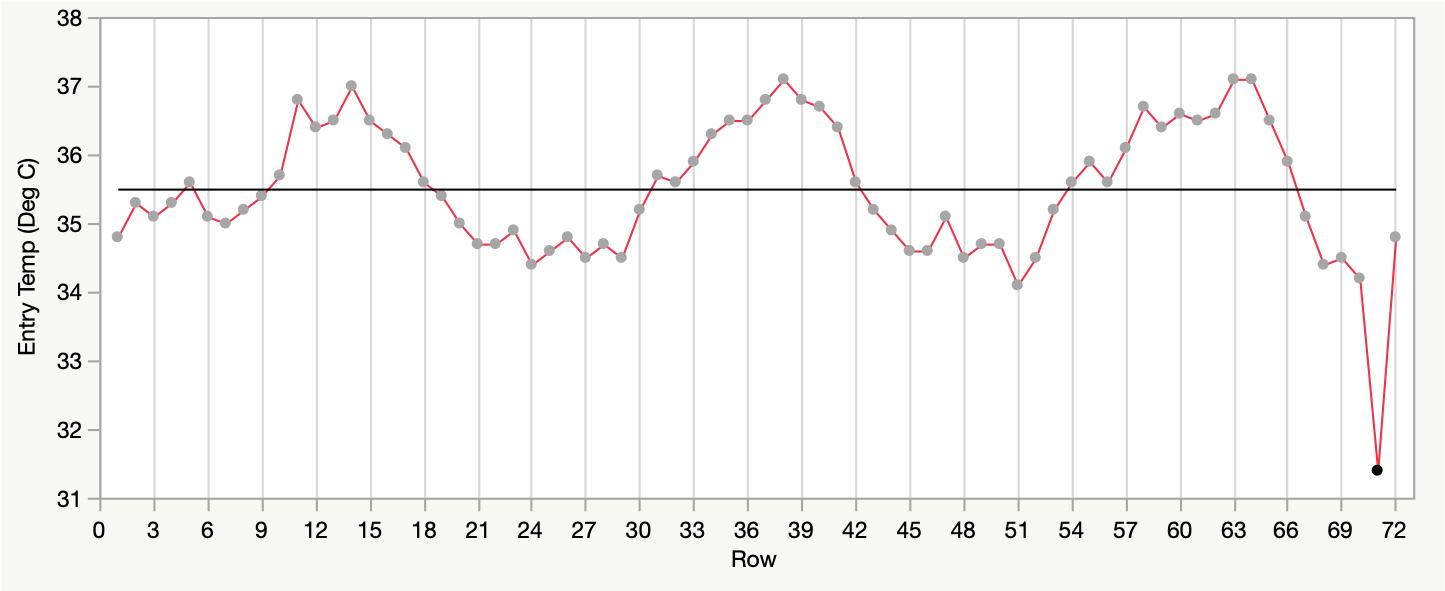
Interpreting data to understand the voice of the process
Understanding Process Variations
Differences between common and special cause variation
Analysing process variation
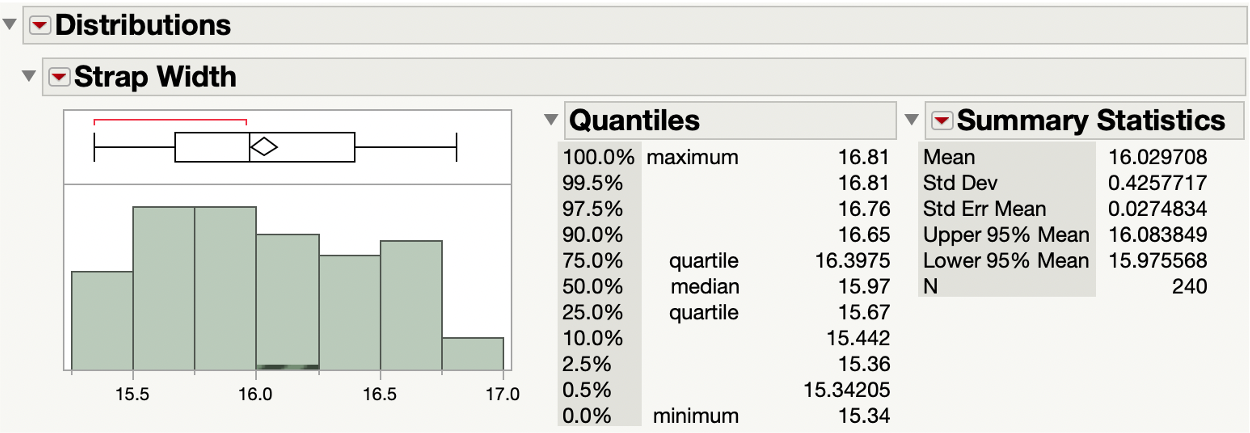
Distribution
Normal Distribution
Understanding the characteristics of a normal distribution and how to use a normal curve in estimating the proportion of product that meets specifications
Concluding using data
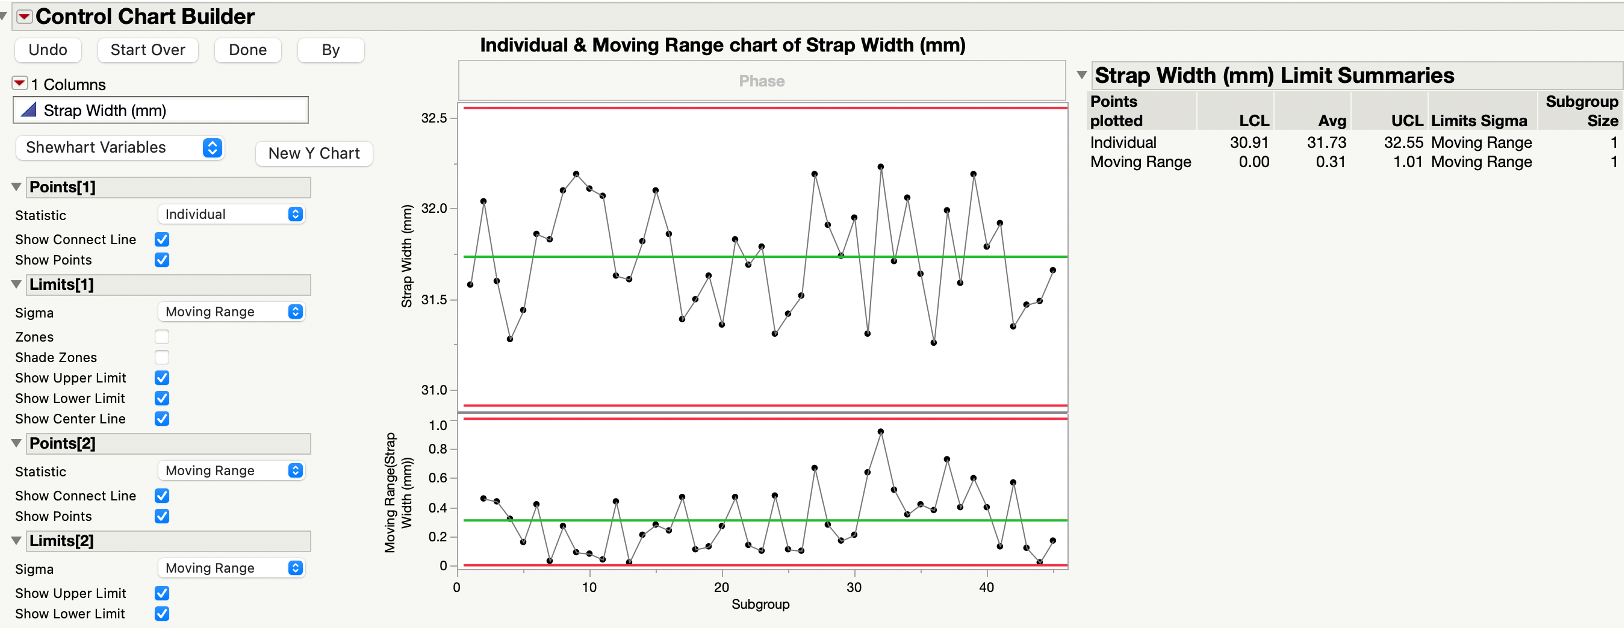
Control charts
Getting to know how control charts and histograms aid in assessing process capability and how to use sample data in estimating population characteristics
Understanding the need and method of calculating the capability of processes
 By admin
June 20, 2021
By admin
June 20, 2021