Minitab Training will help you understand statistics and data analysis and give you hands-on Minitab Software. This program covers basic statisitical theories and tools along with Minitab tools and application. The Minitab Data Analysis program is structured on Six Sigma’s DMAIC framework.
What is Minitab?
Minitab is a software package that helps us in the analysis of data. It is also extensively used by Six Sigma Experts a is an important part of studying data, particularly in the Measure and Analyse phases of DMAIC. Minitab provides a quick, effective solution for the level of analysis. Let’s understand how to conduct Statistical Data Analysis using Minitab effectively.
Statistical Data Analysis: Minitab Training
Statistics and DMAIC
This Minitab Training is designed as per DMAIC structure of Six Sigma. Because Six Sigma is an investigative problem-solving methodology and Statistical Data Analysis is the backbone of Six Sigma.
In DMAIC methodology, the problem is defined in the first phase.
Measure Phase
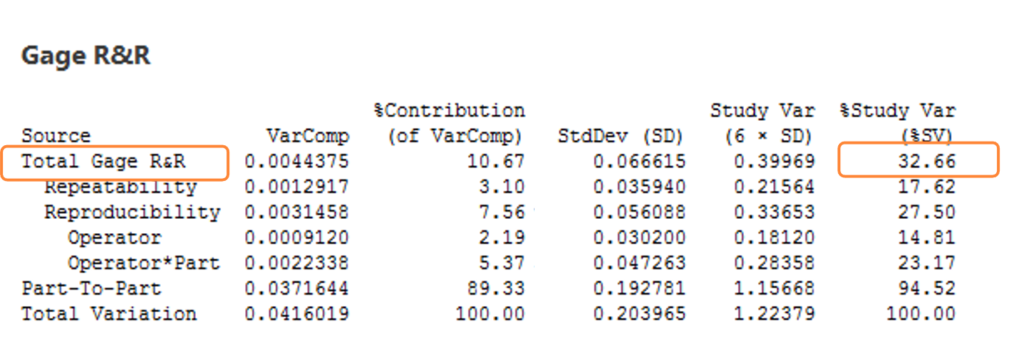
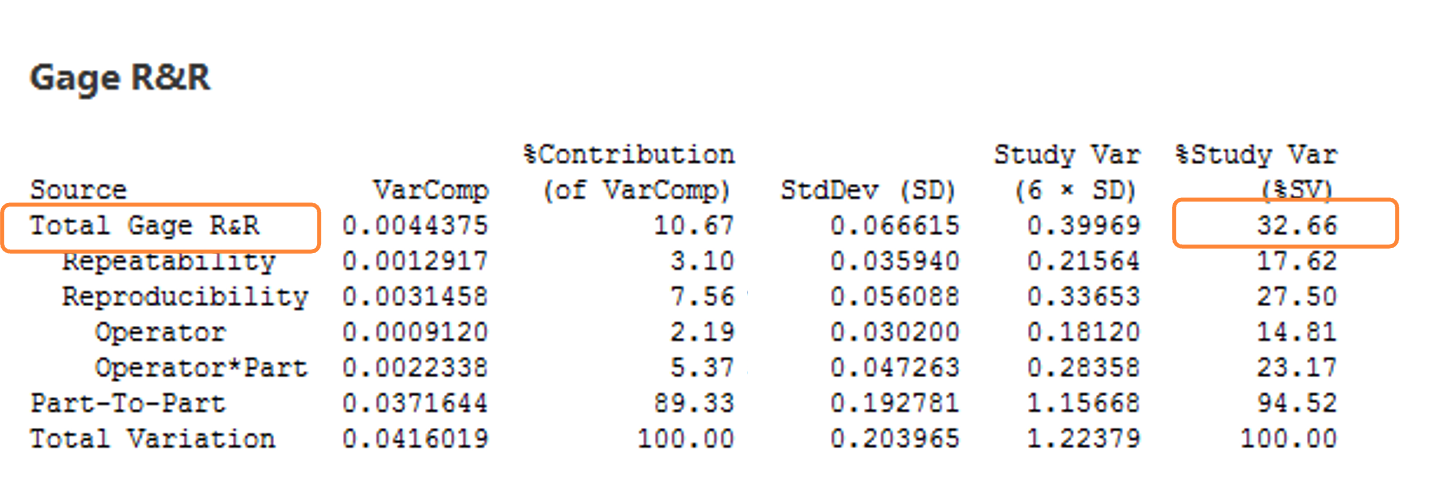
In Measure Phase, the defined problems are measured in terms of statistics. In this phase, the real world problem gets converted into a statistical problem which is easier to solve. We need to be doubly sure that our data is reliable. Hence, we use Measurement System Analysis to check the reliability of our data sources. And also we arrive at a sampling size and sampling methodology, do collect data, we screen the data for errors – trends and patterns, typo-errors, the stability of process to validate that collected data represent the process.
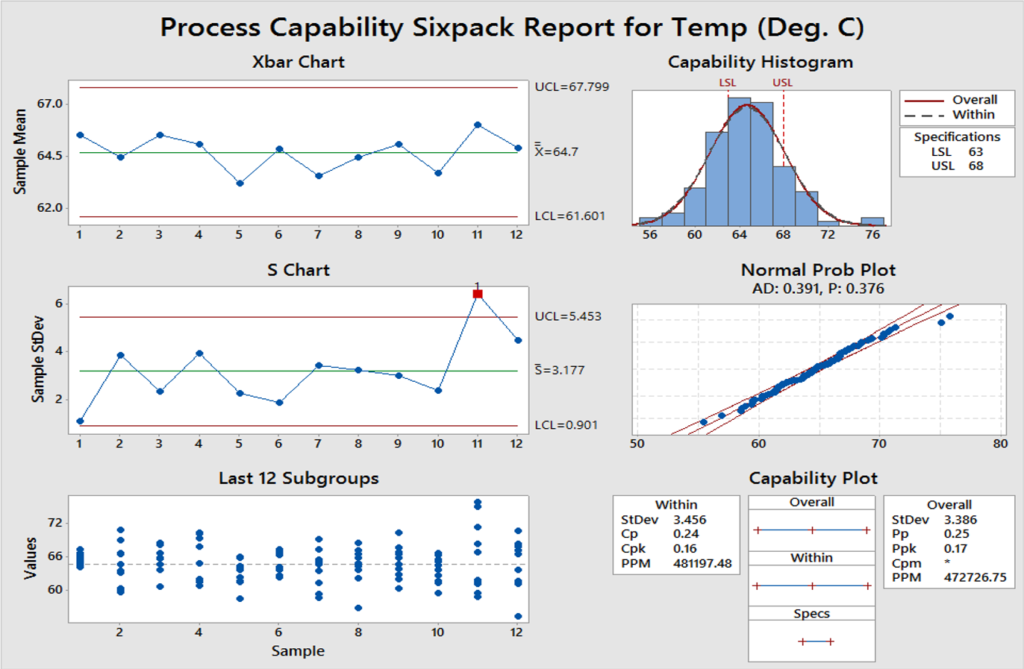
We need to fit our data into a statistical model. Mostly we use Normal-Curve Model. So, we check the Normality of our data to understand how much closer it is to the normal curve model.
If our data fits satisfactorily with Normal curve model, then we use this model to calculate Process Capability. We here discuss three methods of calculating process capability, viz., Defects Per Million Opportunities (DPMO), Process Capability Index – Corrected Process Capability Index (Cp & Cpk) and Standard Normal Approximation method. We learn all these tests in the Minitab Training.
Analyse Phase
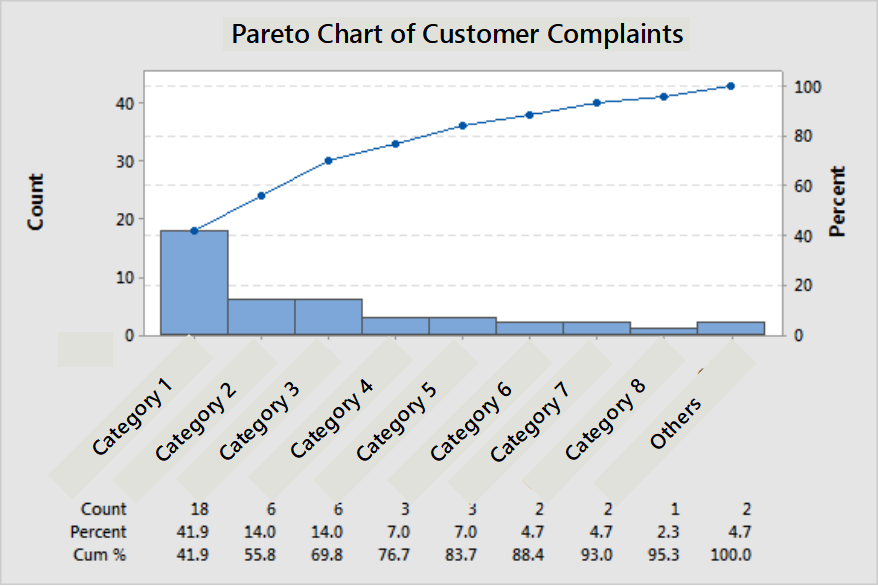
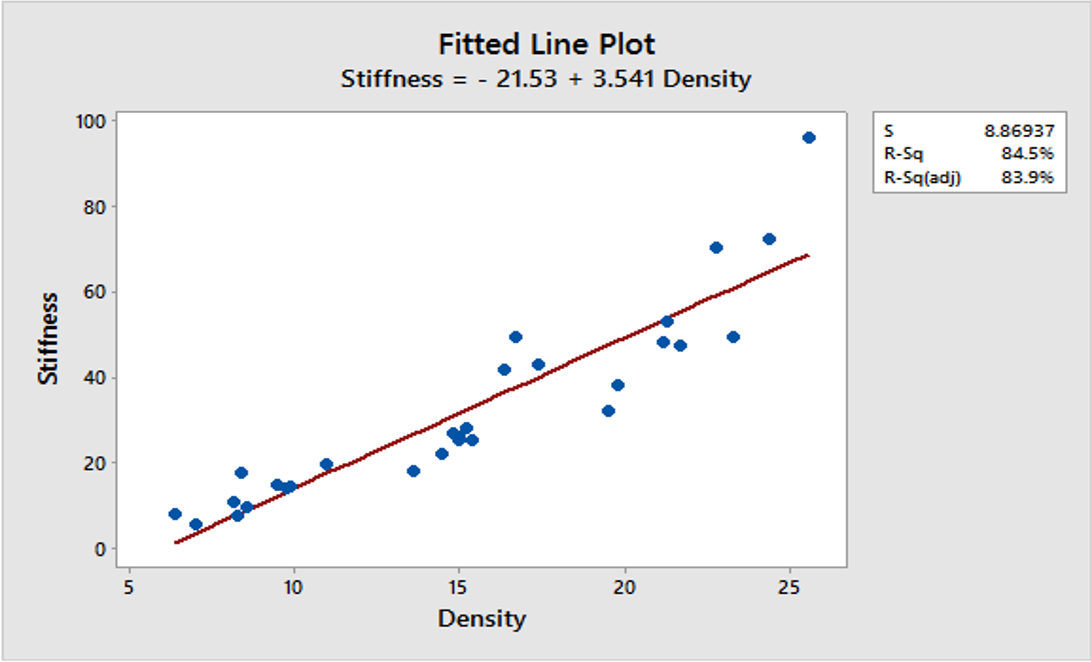
With the mathematical problem – usually poor process capability – low capability number, we proceed to Root cause analysis in the Analyse Phase. The root causes of the problem are identified and proved in Analyse Phase using Statistical Tools like Hypothesis Testing, Regression, BoxPlot, Histogram, Pareto, Design of Experiments. In Analyse phase we arrive at statistical solutions to statistical problems. We look at all data analysis tools, namely, Pareto chart, Box-plot, Histogram, Hypothesis testing using the 1-sample t-test, 2-sample t-test, paired t-test, ANOVA, Regression Analysis in this Minitab Training.
Control Phase
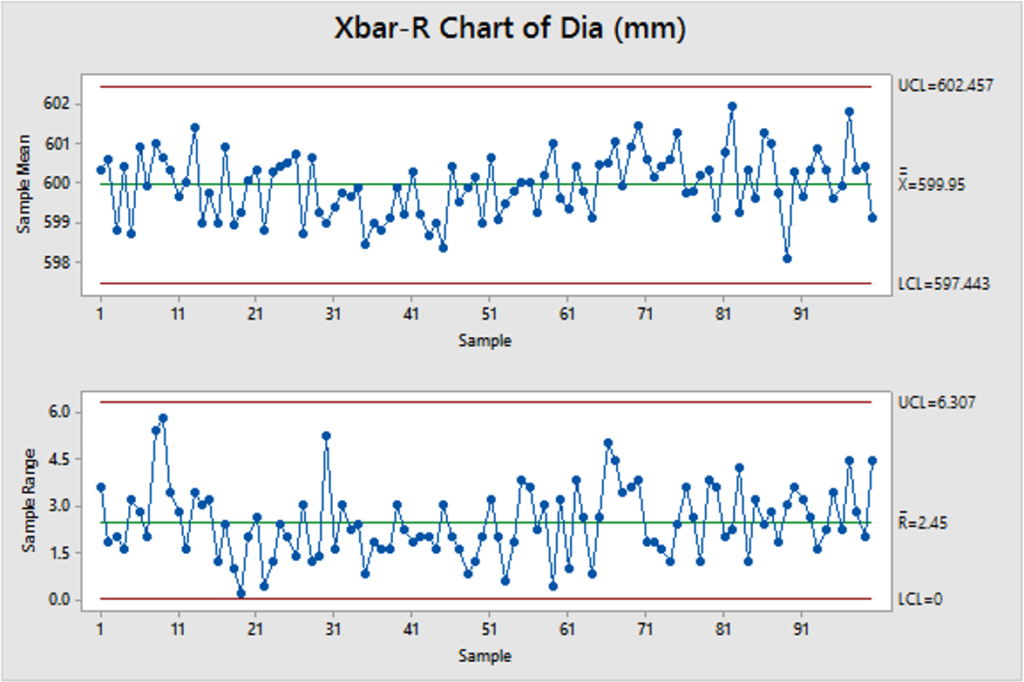
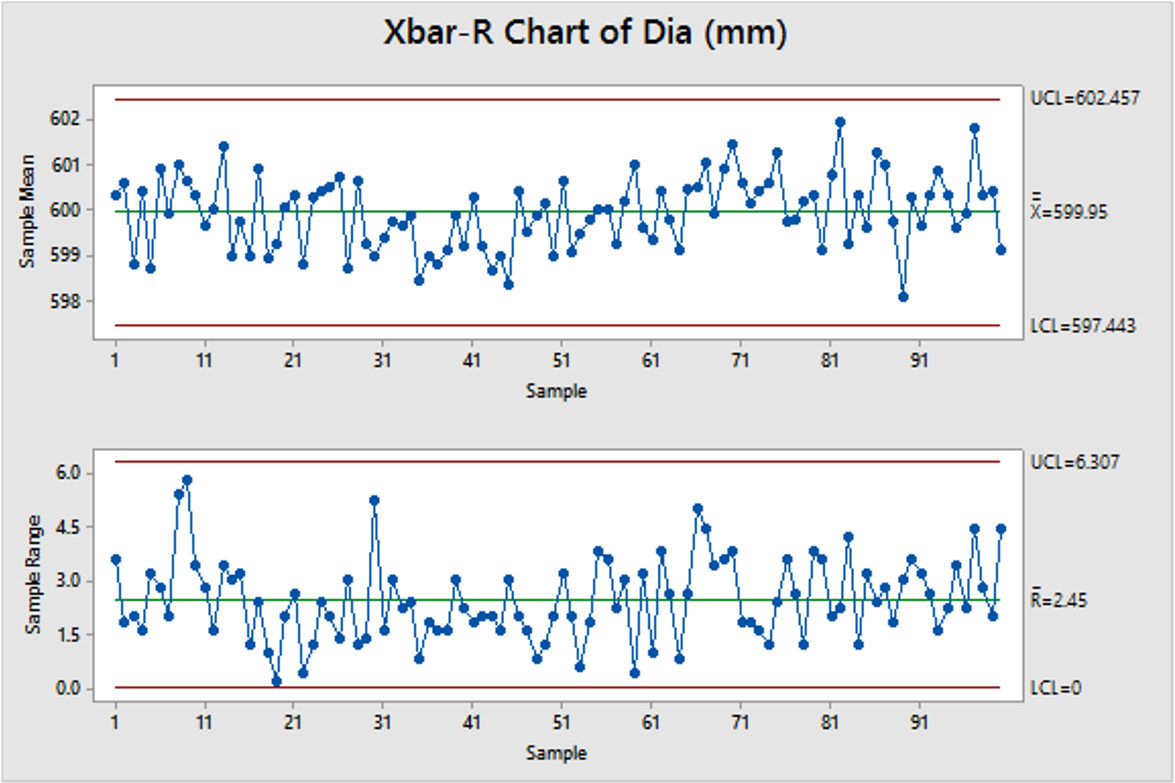
We convert the statistical solutions into real life solutions at Improve Phase. Once the improvements are achieved and the problem is solved, we move on to make the changes getting into practice through Control Phase. As the saying goes, focus on your duty and results will follow, we will control the factors using control charts to keep the problem away. We understand uses of various control charts and generation of charts using Minitab in this Minitab Training.
Training Contents
Measure
Basics of Statistics
Types of Data
Data Collection & Display
Frequency Table
Concentration Diagrams
Stem and Leaf Diagrams
Frequency Distribution
Histogram
Descriptive Statistics
Definitions
Population and Sample
Why do we need samples?
Different methods of sampling
Estimating Sample Size
Properties of data
Central Tendency
Mean, Median, Mode & Quartiles
Dispersion
Range, Variance, Standard Deviation & IQR
Introduction to Minitab
Descriptive Statistics using Minitab
Inference from Data
Inferential statistics
Probability Distributions
Normal Distribution
Measurement System Analysis (based on AIAG Guidelines)
 By admin
May 21, 2017
By admin
May 21, 2017