This program covers the basics of Data Analysis. Don’t worry about your current proficiency.
Green Belt Tools
It will help you perform all the statistical analysis required for a Six Sigma Green Belt Project.
Minitab / Excel
Choose between Minitab or MS Excel – Two different batches
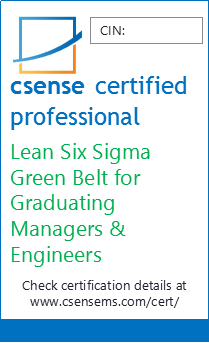
Join Us to Become CSense Certified Professional!
COURSE CONTENTS
Minitab Batch
Types of Data
Data Collection & Display
Frequency Table
Concentration Diagrams
Stem and Leaf Diagrams
Frequency Distribution
Histogram
Descriptive Statistics
Definitions
Population and Sample
Properties of data
Central Tendency
Dispersion
Introduction to Minitab
Descriptive Statistics using Minitab
Basic Data Analysis Tools
Histogram
Pareto Analysis
Box Plot
Inference from Data
Inferential statistics
Probability & Normal Distribution
Understanding the Behaviour of collected data
Trends & Patterns in Data
Variation & its consequences
Test for Normality
SPC Overview & Control Charts
Types of Control Charts – Applications
I Chart
X-bar – R Chart
Regression Analysis
Scatter plot
Regression equation
Linear & Non-linear regression models
Hypothesis Testing
1 sample t test
2 sample t test
ANOVA
Excel Batch
Types of Data
Data Collection & Display
Frequency Table
Concentration Diagrams
Stem and Leaf Diagrams
Frequency Distribution
Histogram
Descriptive Statistics
Definitions
Population and Sample
Properties of data
Central Tendency
Dispersion
Descriptive Statistics using MS Exel
Basic Data Analysis Tools
Histogram
Pareto Analysis
Inference from Data
Inferential statistics
Probability & Normal Distribution
Understanding the Behaviour of collected data
Trends & Patterns in Data
Variation & its consequences
SPC Overview & Control Charts
Types of Control Charts – Applications
I Chart
X-bar – R Chart
Regression Analysis
Scatter plot
Regression equation
Linear regression model
Hypothesis Testing
1 sample t test
2 sample t test
CSense Certification & Authentication
We certify every participant qualifying the requirements of the course, with unique Certification Identification Number (CIN).
In addition to the certification, we also provide a Certification Soft-Badge to qualifying participant with CIN.
Trace the authenticity of your certificate, with details of course, duration, dates of training undergone, etc. Help your superiors or recruiters to trace your certification details at www.csensems.com/cert with you CIN.

 By admin
July 24, 2020
By admin
July 24, 2020