What is I-MR Chart? How to create in MS Excel?

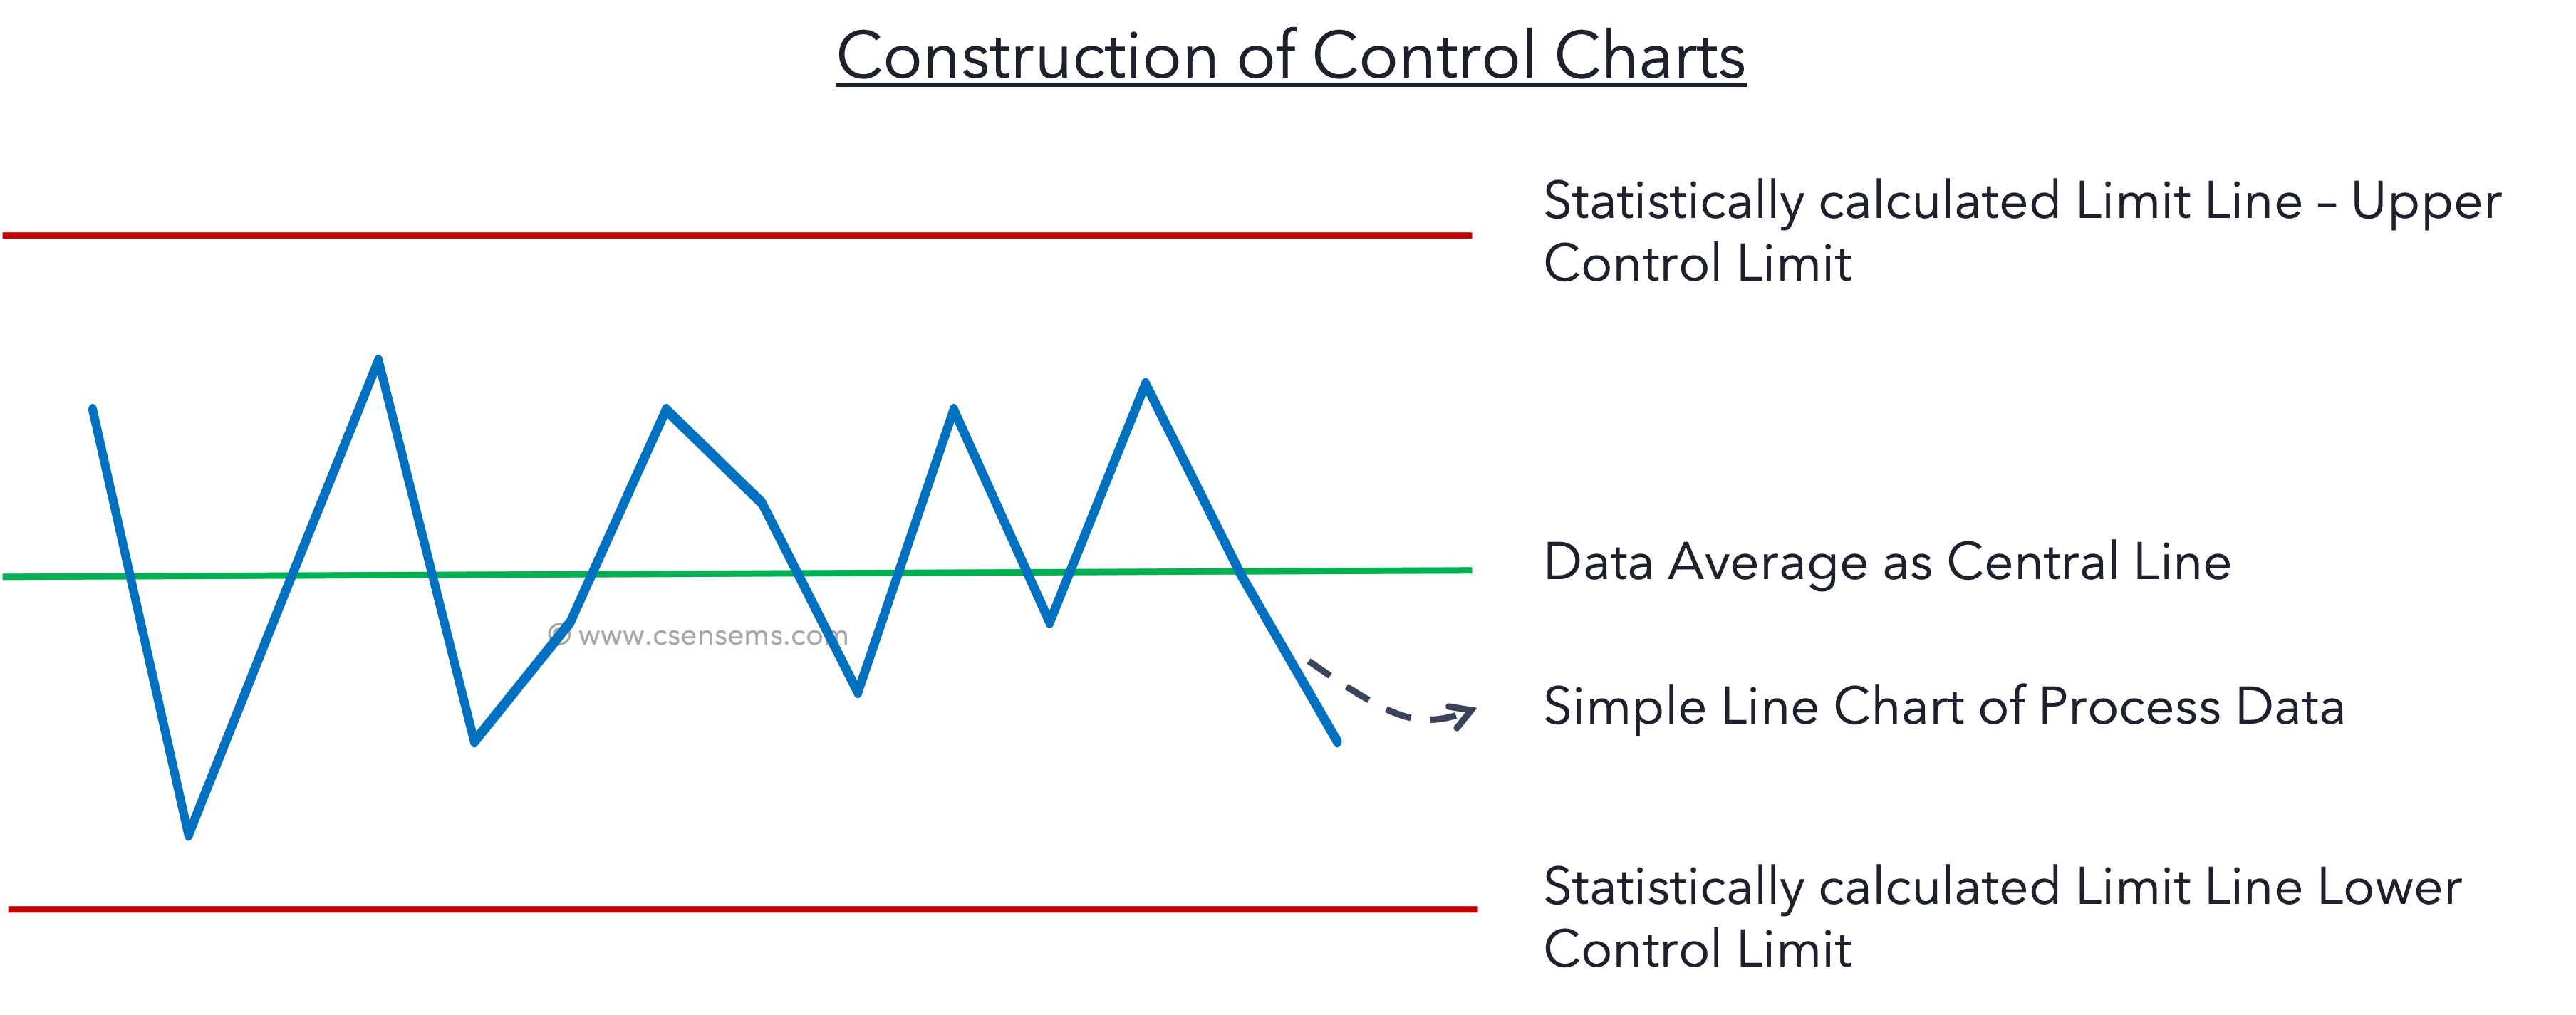
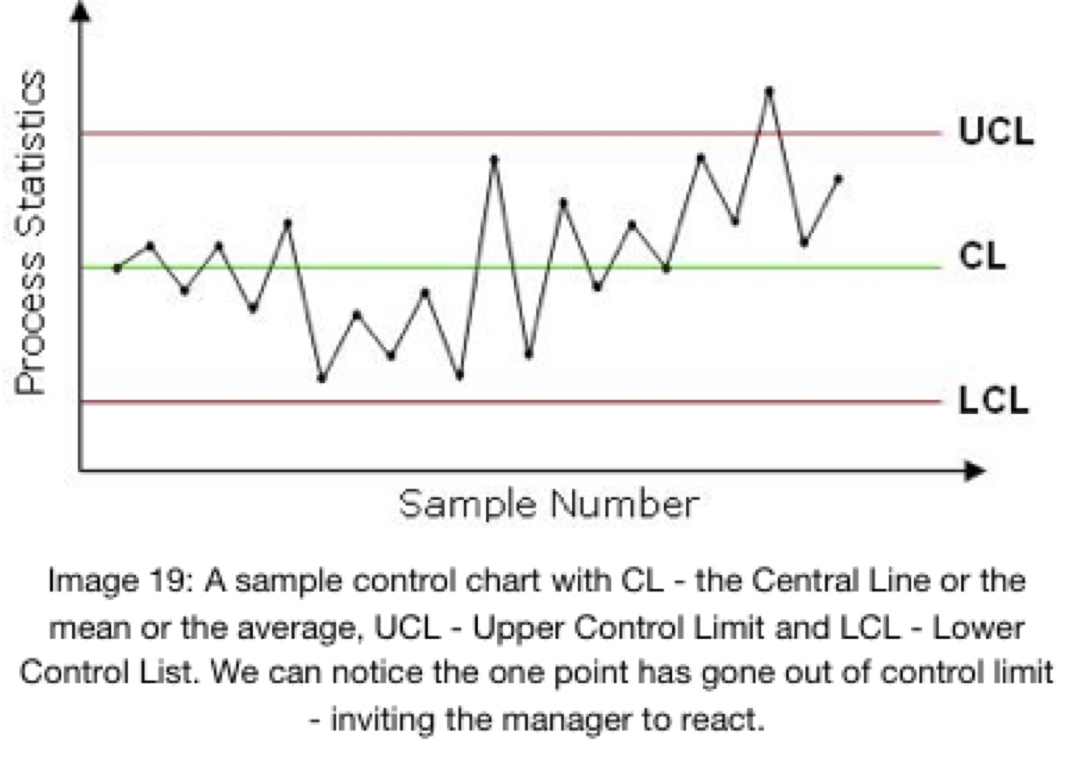
With an updated Excel template What is a control chart? We have already seen what a control chart is in an earlier short article. It helps the process owner to predict when his process is going to produce a defect. Control charts are made by drawing mean line and control lines superimposing the simple line chart of process data*. Here depending on the type of data we possess the type of control chart, and the process data will vary. What...

Read More →

What is Process Stability?

Process Stability Process A process is a set of sequential activities that convert the input to the desired output. Stability Process stability is the ability of the process to perform within a predictable limit. We can also state stability of a process refers to its predictability. Why processes become unstable? Processes tend to become unstable over time due to variations. The variations occur either because of the inherent nature of the process or some external or forced changes, called disturbances....

Read More →

SPC – Statistical Process Control – புள்ளியியல் செயல்முறைக் கட்டுப்பாடு

நாம் முன்பு விவாதித்தபடி, டெய்லரின் நேரம் மற்றும் இயக்கக் கணக்கீடு முறை மற்றும் ஃபோர்டின் சிந்தனையாளர்கள் மற்றும் செய்பவர்கள் என்ற பாகுபாடும் பிரபலமாகி உலகெங்கும் பரவலாக ஏற்றுக்கொள்ளப்பட்டன என்பதை முந்தைய சில அத்தியாயங்களில் பார்த்தோம். இந்த அத்தியாயத்தில் SPC என்றழைக்கப்படும் புள்ளியியல் சார்ந்த தரக்கட்டுப்பாட்டு முறையின் தோற்றத்தையும், SPC யின் அடிப்படையையும் பற்றி விவாதிப்போம். உற்பத்தித் திறன் பெருக்கம் ஃபோர்டின் வேலைப் பிரிவுக் கோட்பாடுகளின் அடுத்த கட்டமாக, பணித் துறைகள் (departments / divisions) நடைமுறைக்கு வந்தன. நாட்கள்செல்லச் செல்ல, ஒவ்வொரு துறையும் அதற்கு ஒதுக்கப்பட்ட பணிகளை முடிப்பதிலேயே கவனம் செலுத்த ஆரம்பித்தன. திறமையான பணியாளர்கள் ஃபோர்மேன் / சூப்பர்வைசர்களாக நியமிக்கப்பட்டனர். ஒவ்வொரு கட்டத்திலும் தயாரிப்புகளை ஆய்வு செய்யும் பணி திறமையான மற்றும்...

Read More →